Page 4 of 13 FirstFirst ... 2 3 4 5 6 ... LastLast
Results 31 to 40 of 126

Daily Market Forecast By Capitalcore

This is a discussion on Daily Market Forecast By Capitalcore within the Analytics and News forums, part of the Trading Forum category; Current Market Sentiment and Technicals on AUD/USD H4 Chart The AUD/USD forex pair, often referred to by its nickname “Aussie,” ...


  1. #31
    Junior Member Capitalcore's Avatar
    Join Date
    May 2024
    Posts
    126
    Current Market Sentiment and Technicals on AUD/USD H4 Chart

    The AUD/USD forex pair, often referred to by its nickname “Aussie,” is a popular currency pair in the forex market, representing the exchange rate between the Australian Dollar (AUD) and the United States Dollar (USD). This pair is influenced by various economic factors, including interest rates, commodity prices, and economic data from both Australia and the United States. Today, the focus will be on several key economic indicators from the U.S. which may impact the AUD/USD pair.
    The U.S. Core PCE Price Index m/m is forecasted at 0.2%, indicating a potential influence on inflation expectations and monetary policy decisions by the Federal Reserve. A lower-than-forecast result could weaken the USD, providing some support to the AUD. Additionally, Personal Income and Personal Spending data, forecasted at 0.4% and 0.3% respectively, will give insights into consumer health and economic activity. The Revised University of Michigan Consumer Sentiment and Inflation Expectations are also crucial, as they reflect consumer confidence and inflation outlook. Any deviation from forecasts in these data points could lead to significant movements in the AUD/USD pair. Moreover, the ongoing G20 meetings may introduce additional volatility, as global economic policies and issues are discussed, potentially impacting currency markets.

    Chart Notes:
    • Chart time-zone is UTC (+03:00)
    • Candles’ time-frame is 4h.

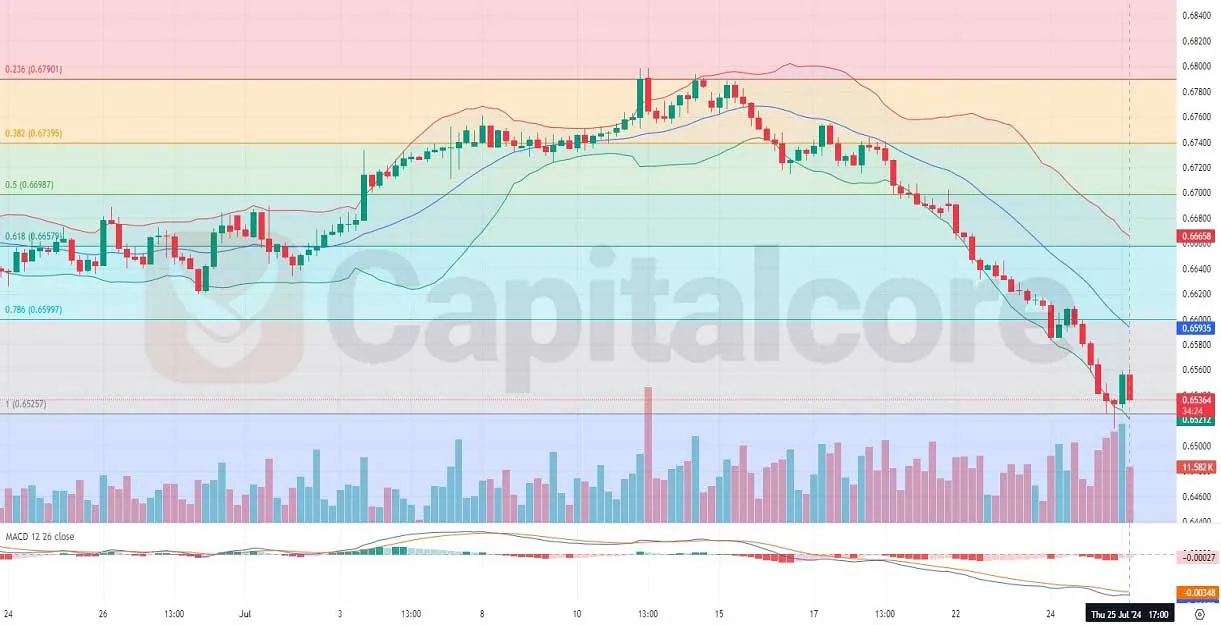
    The H4 chart of AUD/USD shows a strong bearish trend, characterized by a series of red candles over the past few days, with only a few bullish interruptions. The price has consistently moved within the lower half of the Bollinger Bands, often touching or staying close to the lower band, indicating strong downward momentum. Despite the bands widening, indicating increased volatility, the price has failed to reach the middle band, reinforcing the bearish outlook in the AUDUSD price. The MACD and histogram also support this bearish trend, showing a downward trajectory. The Fibonacci retracement levels have not significantly stopped the downtrend, serving only as minor resistance points. After touching the 1.0 Fibonacci level, the price experienced a brief bullish correction, but the most recent candle has turned bearish again, suggesting that the downtrend may continue.

    • DISCLAIMER: Please note that the above analysis is not an investment suggestion by “Capitalcore LLC”. This post has been published only for educational purposes.

    Capitalcore

  2. #32
    Junior Member Capitalcore's Avatar
    Join Date
    May 2024
    Posts
    126
    EURUSD H4 Chart Insights and Predictions

    The EURUSD forex pair, often nicknamed “Fiber,” is a popular currency pair in trading, representing the euro against the U.S. dollar. This pair is heavily influenced by economic indicators from both the Eurozone and the United States, making it a prime choice for traders seeking to capitalize on macroeconomic trends. Today’s focus is on the upcoming Eurozone Consumer Confidence report and the U.S. Pending Home Sales data, both of which are expected to create significant market movements.

    Chart Notes:
    • Chart time-zone is UTC (+03:00)
    • Candles’ time-frame is 4h.

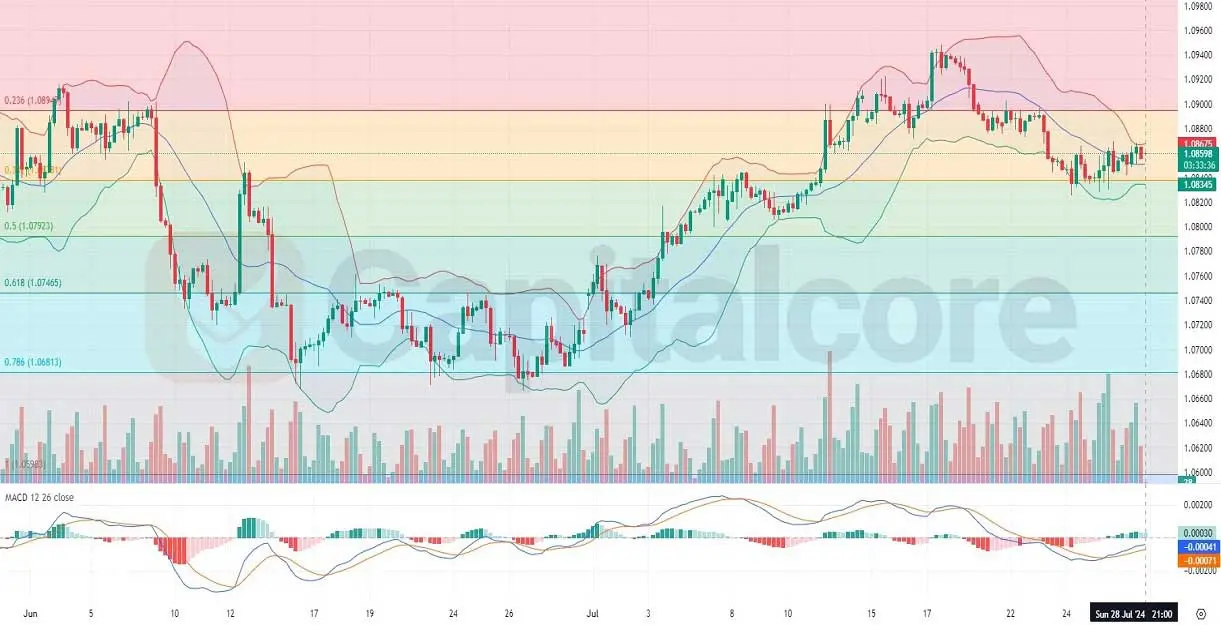
    The H4 chart for EURUSD shows several key technical indicators: Bollinger Bands, Volume, MACD, and Fibonacci Retracement levels. The Bollinger Bands have tightened, indicating reduced volatility, while the price has moved from the lower half toward the upper half of the bands and is currently fluctuating within the upper half. This suggests a generally positive trend with a mixture of bullish and bearish candles. The MACD indicator shows a potential bullish crossover, reinforcing the likelihood of a continued upward movement. Fibonacci retracement levels highlight key support and resistance areas, with the price recently testing and moving above the 50% retracement level, suggesting a potential further upward trend.

    • DISCLAIMER: Please note that the above analysis is not an investment suggestion by “Capitalcore LLC”. This post has been published only for educational purposes.

    Capitalcore

  3. #33
    Junior Member Capitalcore's Avatar
    Join Date
    May 2024
    Posts
    126
    Fundamental and Technical Outlook for EUR/GBP

    The EUR/GBP currency pair, often referred to as the “Chunnel” due to the Chunnel (Channel Tunnel) connecting Britain and mainland Europe, represents the exchange rate between the Euro and the British Pound. This pair is influenced by economic data releases, geopolitical events, and central bank policies from both the Eurozone and the United Kingdom.

    Chart Notes:
    • Chart time-zone is UTC (+03:00)
    • Candles’ time-frame is 4h.

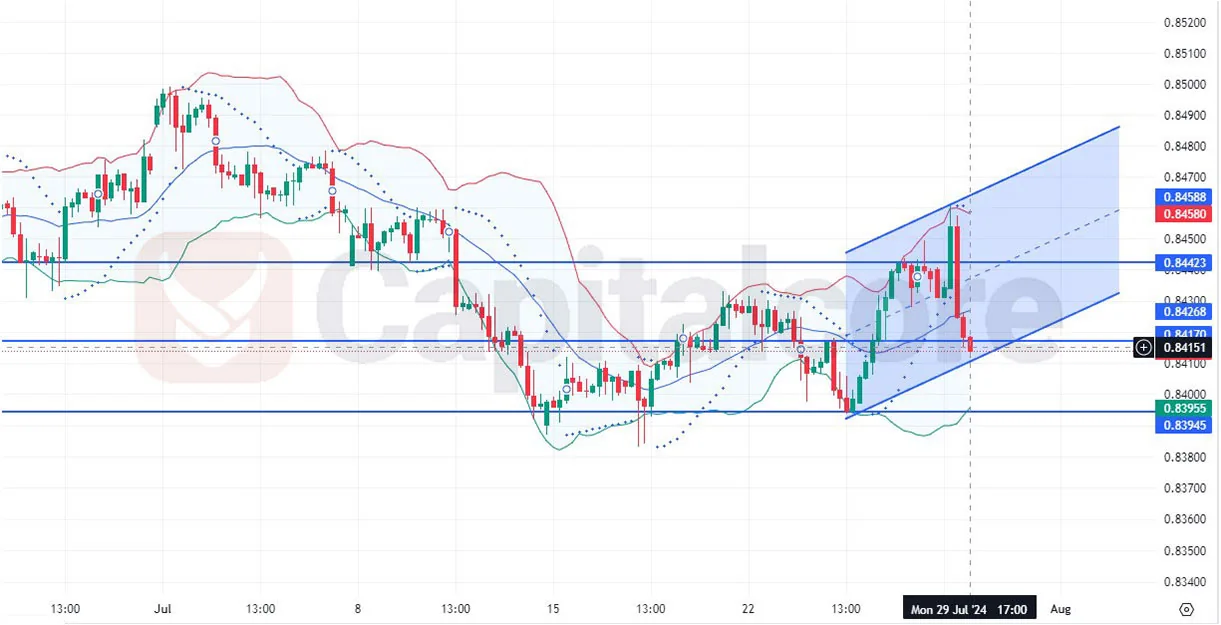
    The EUR/GBP fundamental analysis today is navigating through various economic indicators from both the Eurozone and the UK, with significant upcoming data from INSEE on consumer spending and GDP, as well as Destatis CPI figures, which are expected to influence the Euro. On the UK side, the British Retail Consortium’s price index and Debt Management Office’s bond yields are in focus. Now to the pair’s technical analysis, the EUR/GBP H4 chart shows the price trading within a rising channel, indicating a potential bullish trend. The Chunnel’s price action suggests a pullback from the upper boundary of the channel, with the price testing the lower Bollinger Band, suggesting potential support around the current level. The Parabolic SAR dots are above the price, indicating a bearish phase. Immediate support is at 0.84151, with critical support at 0.83955, and resistance levels at 0.84423 and 0.84588. Positive economic data releases could strengthen the Euro, while strong UK retail data could support the Pound, with bond yields providing insights into investor confidence and interest rate expectations.

    • DISCLAIMER: Please note that the above analysis is not an investment suggestion by “Capitalcore LLC”. This post has been published only for educational purposes.

    Capitalcore

  4. #34
    Junior Member Capitalcore's Avatar
    Join Date
    May 2024
    Posts
    126
    GBPUSD Price Prediction for July 31st

    The GBP/USD, often referred to as "Cable," is currently experiencing interesting dynamics in its price action. The H4 chart reveals that the pair has recently broken below the Ichimoku Cloud, suggesting a bearish sentiment. However, this does not necessarily spell doom for the bulls. The continuation of the bullish wave remains a possibility as long as the price does not fall below the 0.618 Fibonacci retracement level of the previous bullish wave. This level serves as a critical support, providing a potential floor from which the pair could bounce back.

    Chart Notes:
    • Chart time-zone is UTC (+03:00)
    • Candles’ time-frame is 4h.

    Despite the recent bearish signals, there are signs that the market might be gearing up for another upward move. The GBP/USD has found support around the 1.2840 level, which coincides with the key Fibonacci retracement. Meanwhile, resistance is noted near 1.2889. If the pair manages to hold above the 0.618 Fibonacci level, it could attract buyers and potentially resume its upward trajectory. Traders should closely monitor these levels for possible bullish reversals or confirmations of further bearish momentum. As always, staying informed about upcoming economic data and geopolitical developments is crucial for making well-informed trading decisions.

    • DISCLAIMER: Please note that the above analysis is not an investment suggestion by “Capitalcore Ltd”. This post has been published only for educational purposes.

    Capitalcore

  5. #35
    Junior Member Capitalcore's Avatar
    Join Date
    May 2024
    Posts
    126
    Fiber’s Key Levels on EUR/USD Chart

    The EUR/USD forex pair, commonly known as the “Fiber,” is one of the most traded currency pairs in the world, representing the exchange rate between the Euro and the US Dollar. Traders closely monitor this pair for insights into global economic health and monetary policy directions. Today’s EUR/USD outlook is influenced by several low-impact economic indicators from the Eurozone, including the Spanish, Italian, French, and German Manufacturing PMIs. The Spanish PMI is forecasted at 52.5, suggesting industry expansion, while the Italian, French, and German PMIs are expected to remain below the 50 mark, indicating contraction. Additionally, the ECB Economic Bulletin will provide insights into the central bank’s economic assessments. On the USD side, key data such as Unemployment Claims, with a forecast of 236K, and the ISM Manufacturing PMI, expected at 48.8, will be crucial as they reflect the health of the labor market and manufacturing sector in the US.

    Chart Notes:
    • Chart time-zone is UTC (+03:00)
    • Candles’ time-frame is 4h.

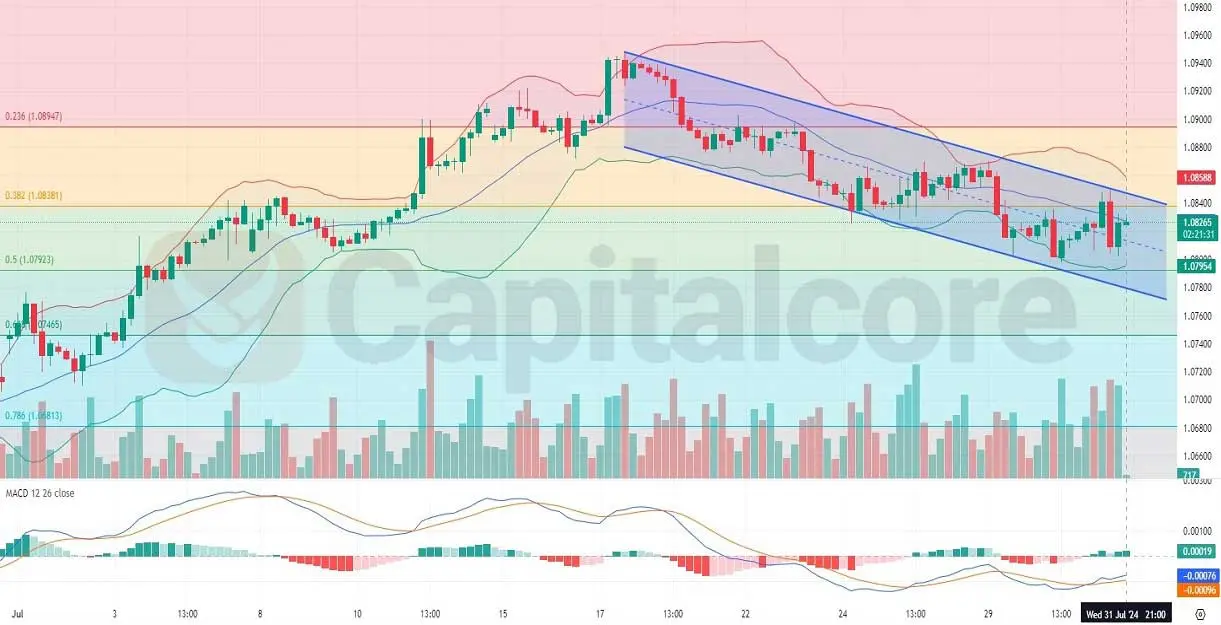
    Analyzing the EUR/USD H4 chart, the pair is currently in a bearish trend, trading within a descending channel. The Bollinger Bands indicate increased volatility as they have widened slightly over the past few days. The price recently moved from the lower Bollinger Band towards the middle band but faced resistance and retreated. However, the last two candles have been bullish, attempting to breach the middle band again. The MACD indicator shows that the MACD line and the signal line are below the zero line, indicating bearish momentum, but the histogram shows diminishing bearish momentum, suggesting a possible reversal or consolidation. The Fibonacci retracement levels indicate that the price is hovering around the 0.5 level, providing significant support and resistance zones. The volume bars show increased activity during the price drops, indicating strong selling pressure. In summary, while the pair is in a bearish trend, recent bullish candles and diminishing bearish momentum in the MACD histogram suggest potential consolidation or a minor bullish correction before resuming the downward trend.

    • DISCLAIMER: Please note that the above analysis is not an investment suggestion by “Capitalcore LLC”. This post has been published only for educational purposes.

    Capitalcore

  6. #36
    Junior Member Capitalcore's Avatar
    Join Date
    May 2024
    Posts
    126
    AUDCHF Daily Chart Technical Analysis


    The AUDCHF forex pair, also known as the "Aussie-Swiss," represents the exchange rate between the Australian Dollar (AUD) and the Swiss Franc (CHF). This pair combines the high-yielding Australian Dollar with the safe-haven Swiss Franc, making it sensitive to both risk sentiment and economic data from Australia and Switzerland. Given the mixed nature of these currencies, trading the AUDCHF can provide opportunities during various market conditions.
    Today's key economic releases include the Australian Producer Price Index (PPI) for Q2, which is expected to show a 1.0% increase. A higher-than-forecast PPI would indicate rising costs for producers, which could lead to increased consumer inflation and potentially support the AUD. On the Swiss side, the Consumer Price Index (CPI) for July is anticipated to drop by 0.2%. A lower CPI would suggest decreasing inflationary pressures, possibly leading to a dovish stance by the Swiss National Bank (SNB). Additionally, the Swiss Manufacturing PMI is forecasted at 44.4, indicating potential contraction in the sector. These data points are likely to influence the AUDCHF pair, with the Australian data possibly providing support for the AUD, while weaker Swiss data might weigh on the CHF.


    Daily Market Forecast By Capitalcore-h4-technical-analysis-audchfon-02.08.2024-2-.jpg


    Chart Notes:
    • Chart time-zone is UTC (+03:00)
    • Candles’ time-frame is 4h.


    The AUDCHF H4 chart shows a strong bearish trend, with the price consistently forming negative candles and moving near the lower Bollinger Band, indicating sustained selling pressure. The Bollinger Bands are widening, which suggests increased volatility, but the overall trend remains bearish. The MACD indicator is showing bearish signals, with both the MACD line and the signal line positioned below the zero line, and the histogram also negative, reinforcing the downtrend. The price is currently between the 1 and 0.786 Fibonacci retracement levels, highlighting a significant downward move from its recent highs.

    • DISCLAIMER: Please note that the above analysis is not an investment suggestion by “Capitalcore LLC”. This post has been published only for educational purposes.

    Capitalcore

  7. #37
    Junior Member Capitalcore's Avatar
    Join Date
    May 2024
    Posts
    126
    AUD/CHF Technical Bearish Indicators

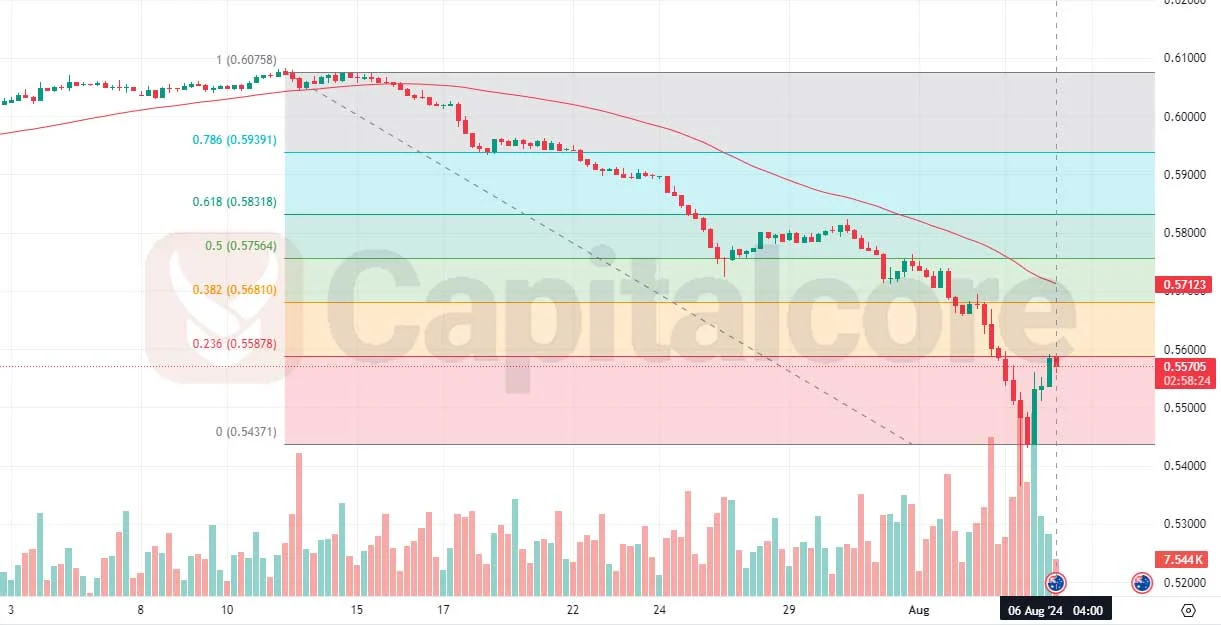
    The AUD/CHF currency pair, often referred to by traders as the "Aussie-Swiss," is currently experiencing a significant bearish trend. This downtrend is evident from the recent price movements shown in the chart, where the pair has been on a consistent decline, breaching several support levels. The price line has recently started a correction phase but remains below the 50-period moving average (MA), indicating that the overall bearish sentiment is still dominant. The pair's inability to cross above this MA suggests that the bearish pressure is likely to persist.

    Chart Notes:
    • Chart time-zone is UTC (+03:00)
    • Candles’ time-frame is 4h.

    At present, the bullish correction has reached the 0.236 level of the Fibonacci retracement drawn from the recent high of 0.60758 to the low of 0.54371. This retracement level is crucial as it often acts as a resistance in a strong downtrend. Given the current market conditions and the lack of significant bullish momentum, it is expected that the AUD/CHF pair will resume its bearish trajectory. The bears appear to be maintaining control, and unless the price breaks above the 0.236 level with substantial volume, the downtrend is likely to continue. Traders should watch for any signs of a further decline, especially if the price fails to sustain above this retracement level.

    • DISCLAIMER: Please note that the above analysis is not an investment suggestion by “Capitalcore LLC”. This post has been published only for educational purposes.

    Capitalcore

  8. #38
    Junior Member Capitalcore's Avatar
    Join Date
    May 2024
    Posts
    126
    EURCHF Technical Outlook on H4 Chart

    The EURCHF forex pair, often referred to by traders as the "Swissy," is a popular pair in the Forex market, representing the euro against the Swiss franc. It is known for its stability and is often traded during times of economic uncertainty due to Switzerland's safe-haven status. As of today, the EUR/CHF is in focus due to upcoming economic releases from both the Eurozone and Switzerland. The German Final CPI is expected to remain at 0.3%, which could have a minimal impact on the euro. Additionally, the Italian Trade Balance is expected to show a surplus of 5.55B, which might lend some support to the euro. On the Swiss side, the SECO Consumer Climate index is forecasted at -36, indicating continued pessimism among Swiss consumers, which could weigh on the Swiss franc. Overall, with these low-impact events, the EUR/CHF might not see significant volatility unless the data significantly deviates from expectations.

    Chart Notes:
    • Chart time-zone is UTC (+03:00)
    • Candles’ time-frame is 4h.

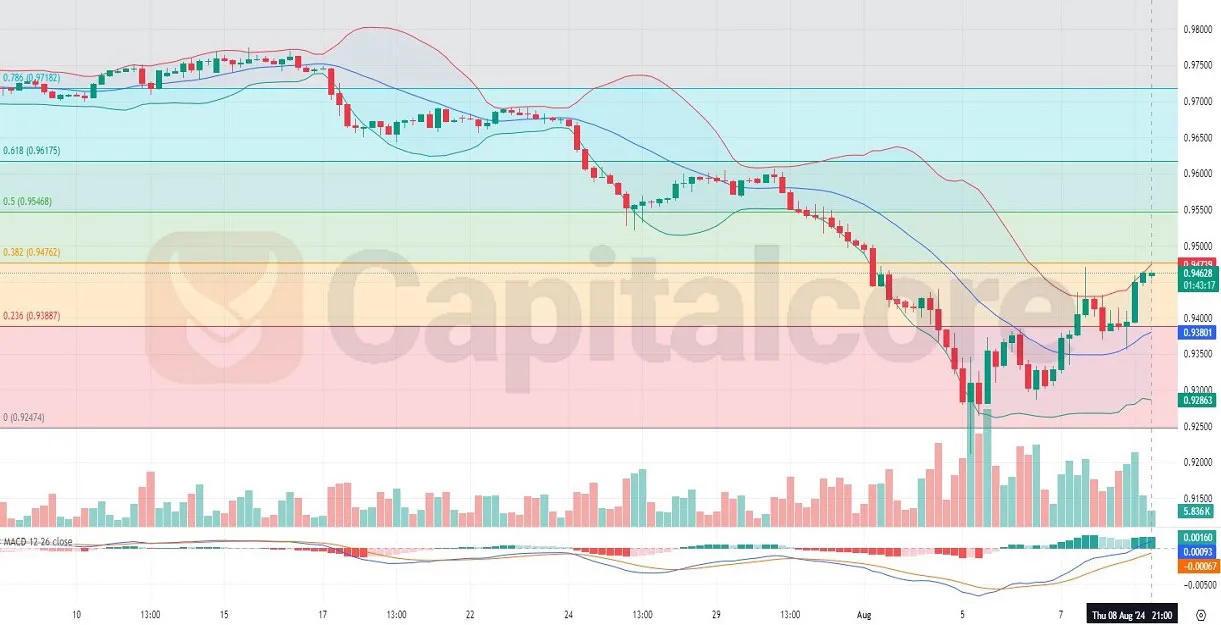
    Looking at the H4 chart of EUR/CHF, the price recently shifted from a bearish to a bullish trend, as evidenced by the movement from the lower Bollinger Band to the upper band. The pair has shown a strong recovery with the last four candles being green and bullish, supported by an increase in green volume bars. The MACD histogram and lines also suggest strengthening bullish momentum. The price is currently situated between the 0.236 and 0.382 Fibonacci retracement levels, indicating that the pair may be testing a key resistance area. If the price manages to break above the 0.382 Fibonacci level, further bullish movement could be anticipated. However, a failure to break this resistance could lead to a consolidation or even a minor pullback.

    • DISCLAIMER: Please note that the above analysis is not an investment suggestion by “Capitalcore LLC”. This post has been published only for educational purposes.

    Capitalcore

  9. #39
    Junior Member Capitalcore's Avatar
    Join Date
    May 2024
    Posts
    126
    USDCAD H4 Chart Bearish Momentum Continues

    The USDCAD currency pair, often referred to by its nickname "Loonie," represents the exchange rate between the US Dollar (USD) and the Canadian Dollar (CAD). The USDCAD pair is highly sensitive to economic data releases and global oil prices, given Canada's significant oil exports. Today, the market's attention is on several low-impact economic indicators, including Canada's Building Permits data and the US Cleveland Fed Inflation Expectations, alongside the US Federal Budget Balance. Although these indicators are not expected to cause major volatility, they provide insights into the economic outlook of both countries. For instance, an increase in Canadian building permits could signal future economic activity, potentially offering some support to the CAD. Meanwhile, the USD will be influenced by inflation expectations and the federal budget, which may impact market sentiment if the figures deviate significantly from expectations.


    Chart Notes:
    • Chart time-zone is UTC (+03:00)
    • Candles’ time-frame is 4h.

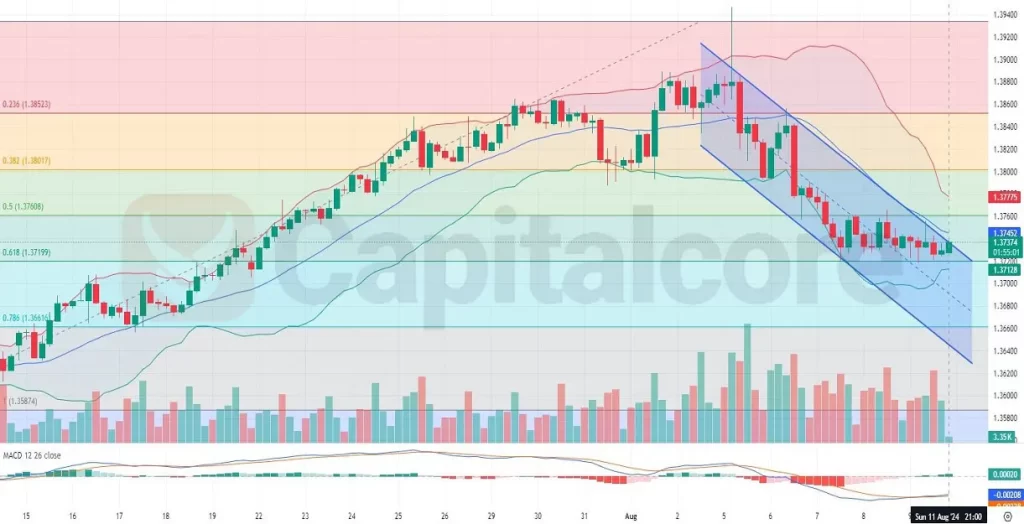
    Analyzing the USDCAD H4 chart, the price has been trending downward, confined within a bearish channel. Out of the last 20 candles, only 6 have been bullish, indicating persistent selling pressure. The price is moving within the lower half of the Bollinger Bands, specifically between the lower band and the middle band, suggesting that the bearish momentum remains strong. Additionally, the USD/CAD price is currently oscillating between the 0.786 and 0.618 Fibonacci retracement levels, highlighting potential support and resistance zones. The MACD histogram is showing bearish signals, with the MACD line staying below the signal line, further confirming the ongoing bearish trend. This combination of technical indicators suggests that the USDCAD might continue its downward trajectory unless significant fundamental changes occur.

    • DISCLAIMER: Please note that the above analysis is not an investment suggestion by “Capitalcore LLC”. This post has been published only for educational purposes.

    Capitalcore

  10. #40
    Junior Member Capitalcore's Avatar
    Join Date
    May 2024
    Posts
    126
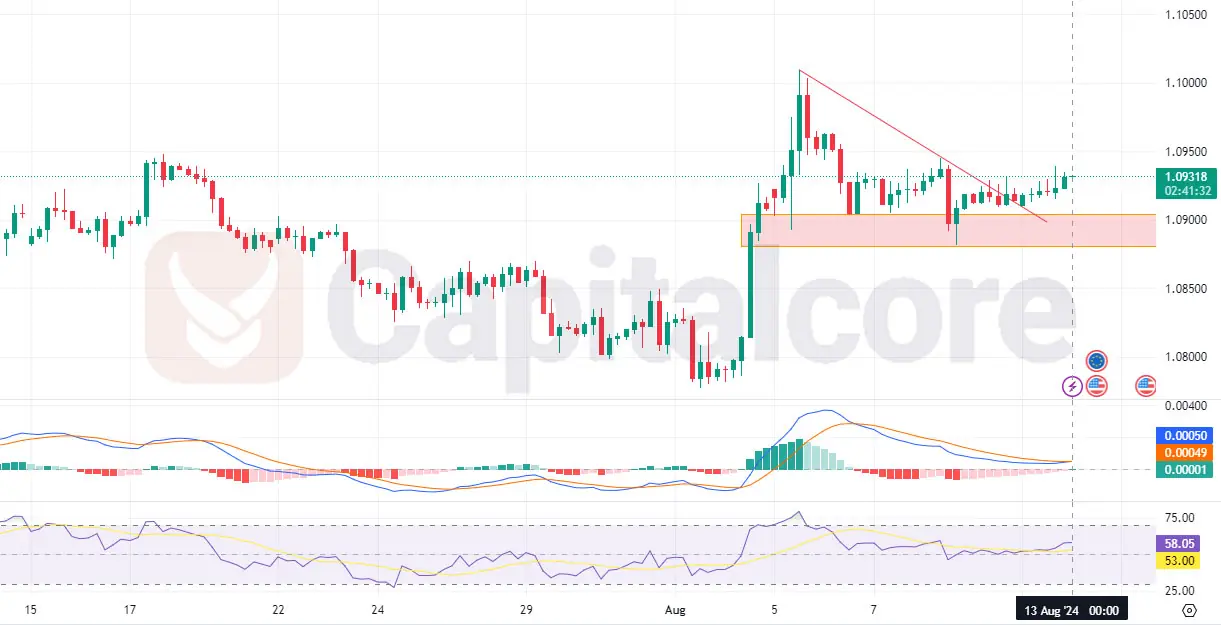
    Potential Impact of Economic Data on EURUSD


    The EUR/USD pair, commonly referred to as the "Fiber" in forex trading circles, is one of the most traded currency pairs in the world. This pair represents the exchange rate between the Euro and the U.S. dollar, reflecting the economic dynamics between the Eurozone and the United States. Observations from the latest H4 chart indicate that the EUR/USD may be poised for a bullish phase following a correction period, suggesting a strong potential for upward movement in the near term.

    Chart Notes:
    • Chart time-zone is UTC (+03:00)
    • Candles’ time-frame is 4h.

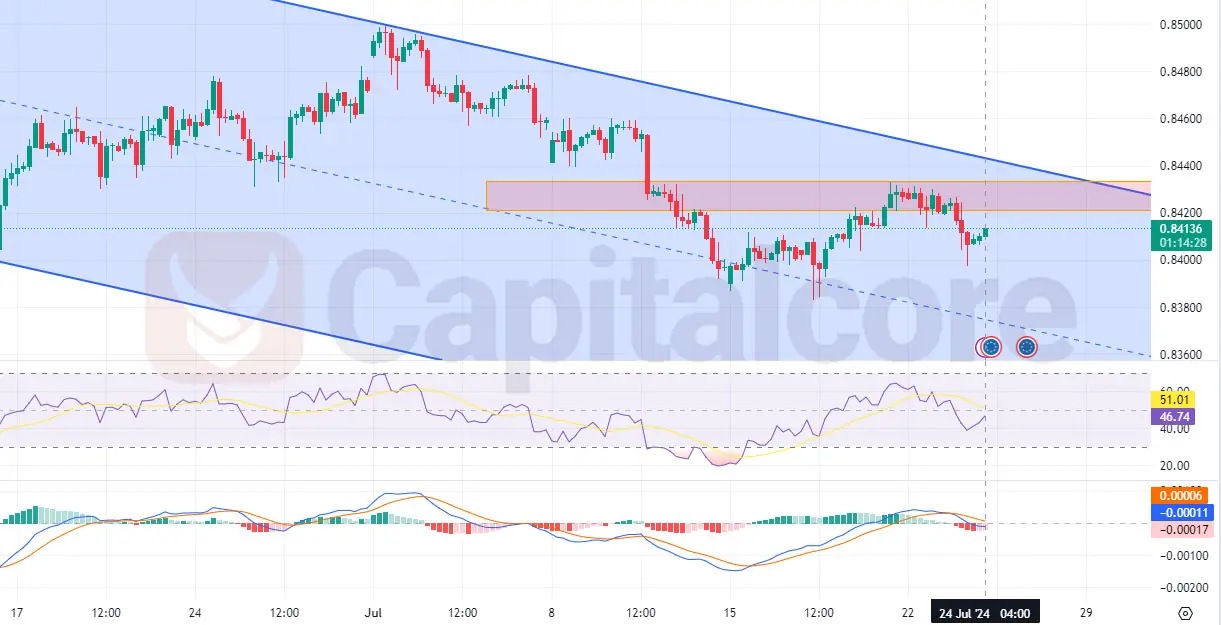
    Upon closer examination of the price action, we can see that this pair has been consolidating within a descending triangle pattern, characterized by a clear resistance around the 1.0950 level and solid support at 1.0900. This pattern typically signals accumulation in technical analysis, where the price action tightens as the market prepares for a potential breakout. The recent behavior of the EUR/USD suggests that traders are possibly gearing up for a move higher, supported by increasing bullish momentum. The MACD indicator further underscores this perspective, with a bullish divergence emerging as the MACD line ascends toward the signal line, indicating growing strength in buying activity. Moreover, the RSI remains robust, positioned above 50 and trending higher, which highlights the persistence of bullish sentiment among traders. This combination of technical signals—particularly the bullish MACD divergence and the strong RSI—strongly points toward a forthcoming bullish breakout. Traders should monitor the 1.0950 resistance level closely; a convincing break above this could open the path to higher resistance levels, affirming the ongoing bullish trend in the EUR/USD market.

    DISCLAIMER: Please note that the above analysis is not an investment suggestion by “Capitalcore LLC”. This post has been published only for educational purposes.: Please note that the above analysis is not an investment suggestion by “Capitalcore LLC”. This post has been published only for educational purposes.

    Capitalcore

Page 4 of 13 FirstFirst ... 2 3 4 5 6 ... LastLast

Bookmarks

Posting Permissions

  • You may not post new threads
  • You may not post replies
  • You may not post attachments
  • You may not edit your posts
  •