GOLD Chart Analysis for Bearish Trend on H4
Gold, commonly known as “the yellow metal”, is traded as GOLDUSD or XAUUSD and remains a critical safe-haven asset in times of economic uncertainty. Today, traders are watching significant USD news releases, including the New York Manufacturing Index and PMI data for both manufacturing and services. Positive US data could strengthen the USD, exerting downward pressure on XAUUSD, while weaker results may boost gold as investors shift to safety.
Chart Notes:
• Chart time-zone is UTC (+02:00)
• Candles’ time-frame is 4h.
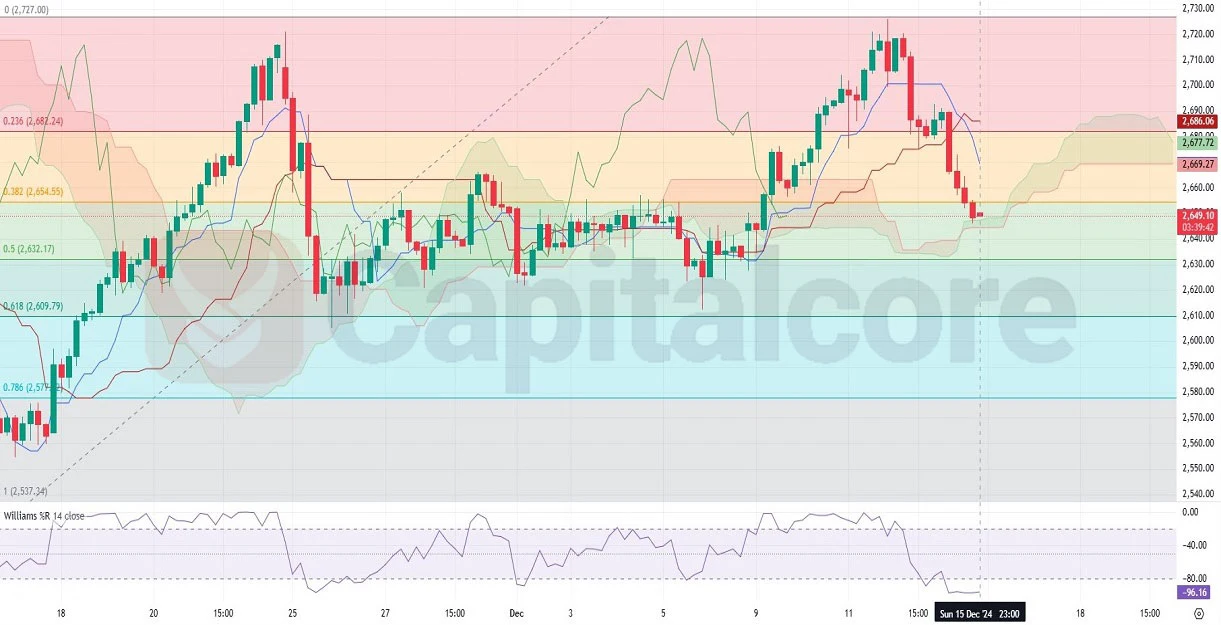
On the GOLDUSD H4 chart, the price has been in a bearish trend, with several consecutive red candles before last week's market close. After opening this week, the price touched the upper cloud section, indicating weakening bullish strength. The price also broke below the 0.382 Fibonacci retracement level at 2,654.55, which now acts as immediate resistance, with further downside potential toward the 0.5 Fibonacci level at 2,632.17.
The Williams %R indicator is currently at -96.16, signaling oversold conditions, which may lead to a short-term bounce but does not negate the bearish momentum. Immediate support is now located at 2,632.17, aligning with the 0.5 Fibonacci level, while resistance is seen at 2,677.72 near the cloud boundary. If buyers cannot regain control, the next support at 2,609.79 could come into focus.
• DISCLAIMER: Please note that the above analysis is not an investment suggestion by “Capitalcore LLC”. This post has been published only for educational purposes.
Capitalcore


 1Likes
 LinkBack URL
 About LinkBacks



 Reply With Quote

Bookmarks