Page 10 of 10 FirstFirst ... 8 9 10
Results 91 to 97 of 97

Daily Market Forecast By Capitalcore

This is a discussion on Daily Market Forecast By Capitalcore within the Analytics and News forums, part of the Trading Forum category; GBPUSD Technical Overview with Key Indicators The GBPUSD currency pair, known as the "Cable," is one of the most actively ...


  1. #91
    Junior Member Capitalcore's Avatar
    Join Date
    May 2024
    Posts
    97
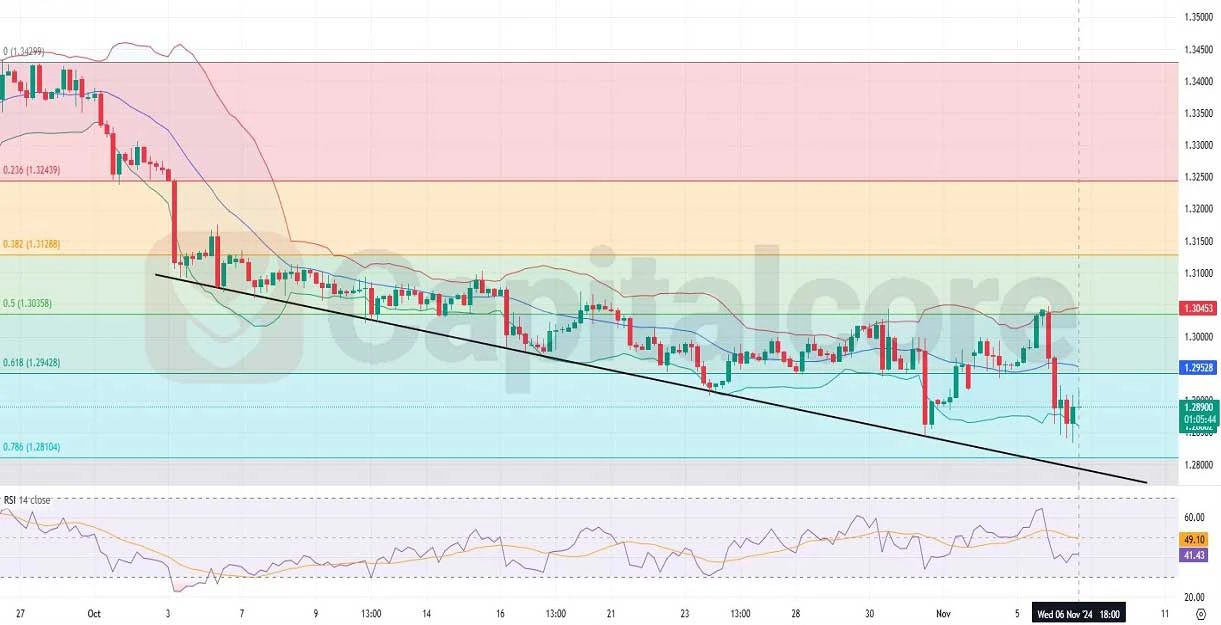
    GBPUSD Technical Overview with Key Indicators

    The GBPUSD currency pair, known as the "Cable," is one of the most actively traded pairs in the forex market, linking the British pound (GBP) with the US dollar (USD). Today, traders will closely monitor several key US data releases, including jobless claims, labor productivity, and unit labor costs, as well as inventory and mortgage data. Lower-than-expected unemployment claims and improved productivity figures may strengthen the dollar, making it harder for the pound to regain footing. Additionally, the Bank of England's ongoing policy outlook and recent statements hint at possible rate stabilization, which may impact GBP demand. These releases, coupled with signals from Federal Reserve officials, could set a volatile trading environment for GBPUSD pair.

    Chart Notes:
    • Chart time-zone is UTC (+02:00)
    • Candles’ time-frame is 4h.

    On the GBP USD H4 chart, the pair has exhibited a gradual downtrend over the past month, with bearish candles outweighing bullish ones, leading to a decline in price. Currently, GBP USD has moved from the upper Bollinger Band to the lower band, with recent strong bearish momentum marked by two solid red candles. After touching the lower band, the GBPUSD price has shown a slight rebound, supported by two bullish candles, indicating potential upward movement within the range of the lower and middle Bollinger Bands. The price currently lies between the 0.786 and 0.618 Fibonacci retracement levels, suggesting a possible support zone that could lead to a temporary recovery before a further move is confirmed by upcoming data releases.

    •DISCLAIMER: Please note that the above analysis is not an investment suggestion by “Capitalcore LLC”. This post has been published only for educational purposes.

    Capitalcore

  2. #92
    Junior Member Capitalcore's Avatar
    Join Date
    May 2024
    Posts
    97
    EURUSD Liquidity Risks on Low Activity Day

    The EURUSD pair, often referred to as the “Fiber,” is one of the most actively traded currency pairs in the forex market. This pair represents the value of the euro, the official currency of the Eurozone, relative to the US dollar, the primary global reserve currency. Today, trading may see lower liquidity and unpredictable volatility due to bank holidays in both France and the United States, marking Armistice and Veterans Day. While low liquidity days can sometimes reduce price movement, they also amplify the role of speculators, which could lead to sharp, irregular price shifts. Additionally, the upcoming Bundesbank bond auction data may provide insight into investor confidence within the Eurozone, potentially impacting EUR USD sentiment. Traders should remain cautious and monitor any unexpected volatility, especially given the variable effects of these news events.

    Chart Notes:
    • Chart time-zone is UTC (+02:00)
    • Candles’ time-frame is 4h.

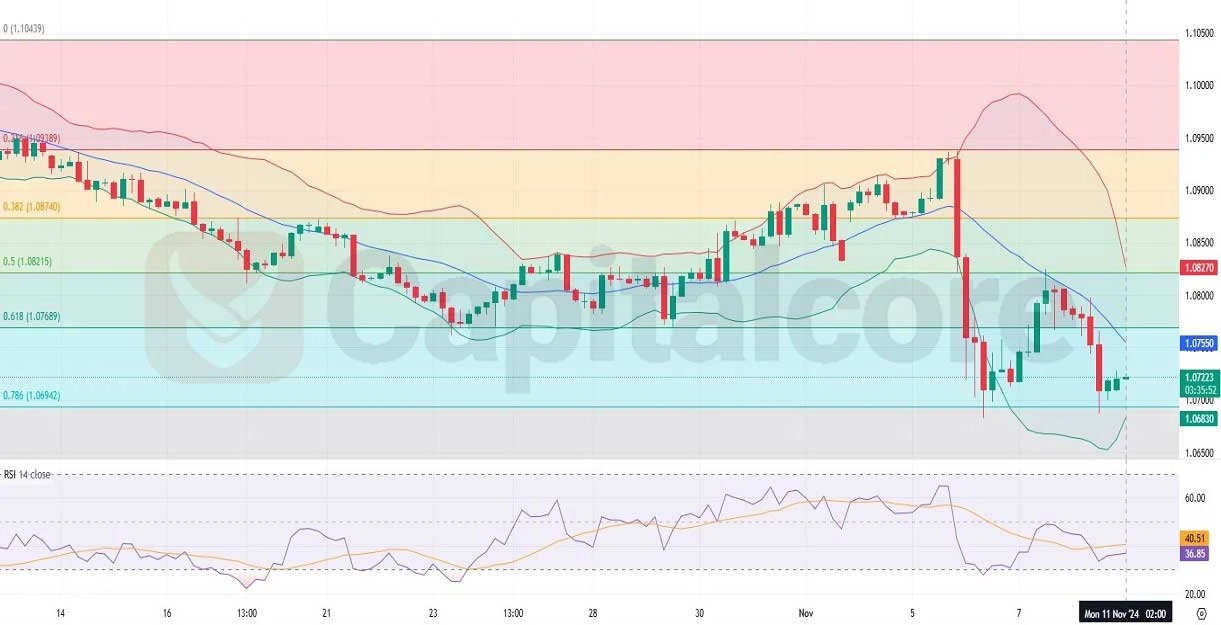
    Looking at the EURUSD H4 chart provided, the price has been trending downward, consistently staying in the lower half of the Bollinger Bands. However, recent candles show a potential bullish reversal, with the last three candles moving upwards, suggesting buyers might be stepping in. The Bollinger Bands have expanded significantly, indicating high volatility. Additionally, the Relative Strength Index (RSI) is near oversold territory, which could hint at further upward correction if the momentum continues. From a Fibonacci retracement perspective, the price is currently between the 0.786 and 0.618 levels, suggesting a potential support area that may hold if buyers continue to show interest.

    •DISCLAIMER: Please note that the above analysis is not an investment suggestion by “Capitalcore LLC”. This post has been published only for educational purposes.

    Capitalcore

  3. #93
    Junior Member Capitalcore's Avatar
    Join Date
    May 2024
    Posts
    97
    EUR/GBP H4 Technical Outlook and Fundamental Forecast

    The EUR/GBP currency pair, often nicknamed "Chunnel," showcases the dynamic economic relationship between the Eurozone and the United Kingdom, both key players in the European market. For today’s EURGBP news analysis, traders are eyeing critical economic data releases, starting with Germany's Wholesale Price Index (WPI) and France's Consumer Price Index (CPI) for the Euro. The WPI, as a leading indicator of consumer inflation, could provide early insights into pricing pressures in Germany, while France's CPI is expected to gauge consumer spending power and inflationary trends, impacting the Euro's appeal to investors. Simultaneously, the UK is releasing multiple economic indicators, including Gross Domestic Product (GDP), the Visible Trade Balance, and the Gross Value Added (GVA) figures. Strong GDP or trade balance results would underscore the UK's economic resilience, potentially supporting the Pound, while weak data might shift market sentiment toward the Euro. With both economies facing inflationary concerns, EUR/GBP’s fundamental signals are crucial in determining whether the Euro or Pound may gain an edge in the pair’s trading environment today, especially amid heightened inflation worries and economic performance considerations across Europe.

    Chart Notes:
    • Chart time-zone is UTC (+02:00)
    • Candles’ time-frame is 4h.

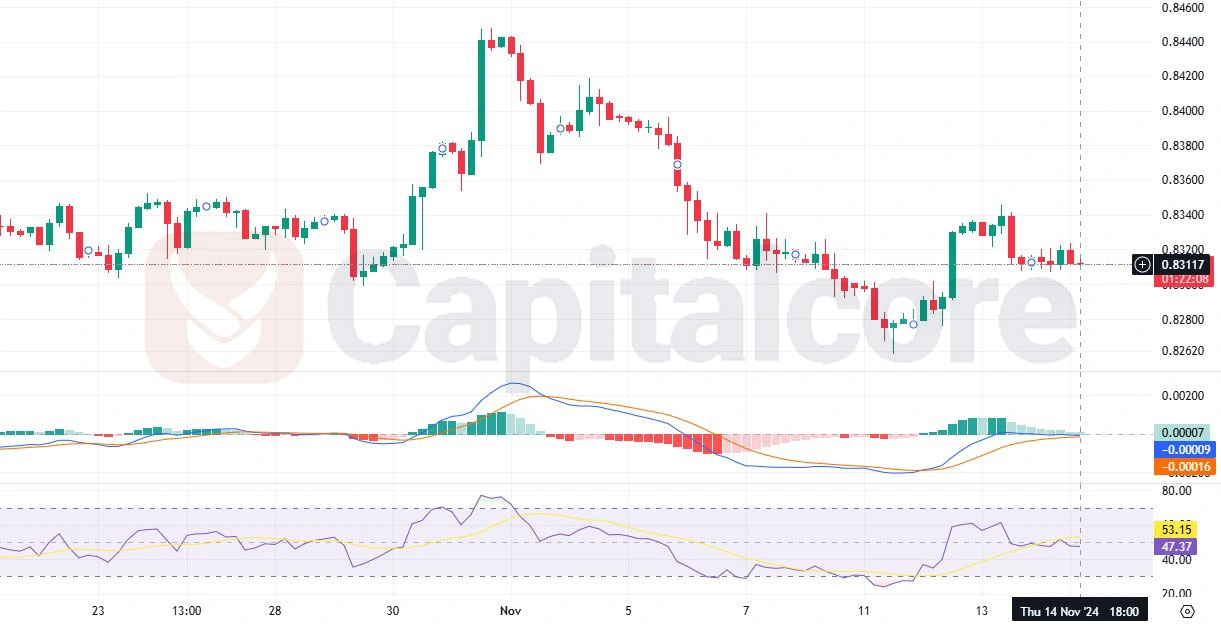
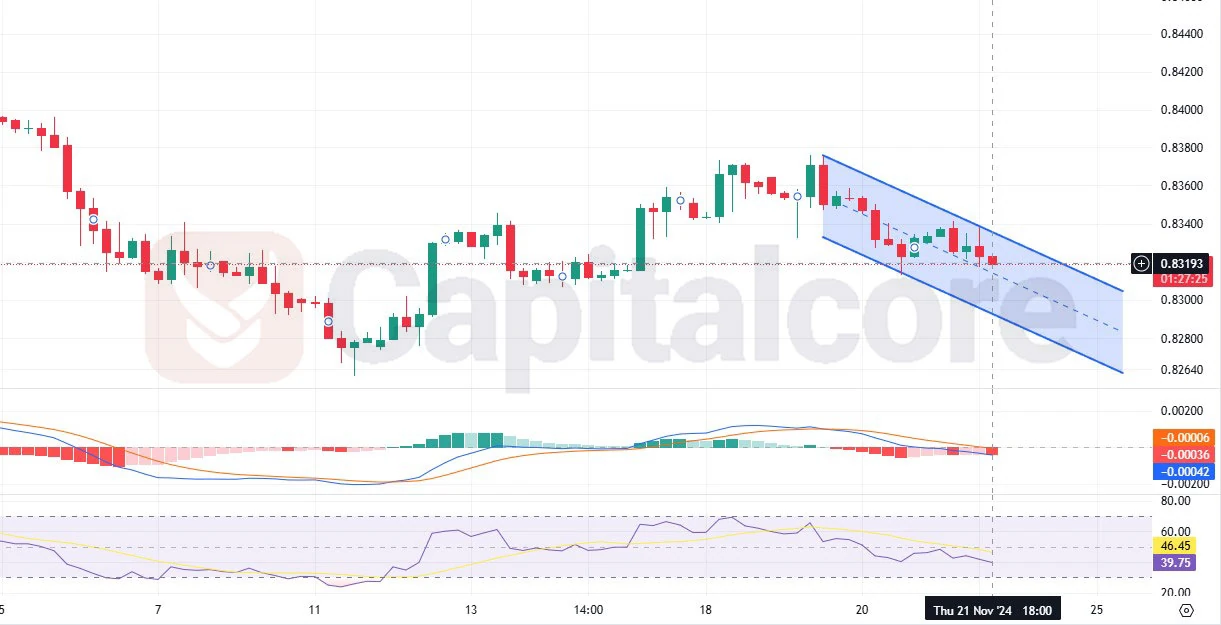
    In the EUR/GBP H4 chart, the candlestick pattern reveals recent “Chunnel” price volatility with significant resistance levels around 0.8340 and support near 0.8280. The Moving Average Convergence Divergence (MACD) indicator displays a bearish crossover, indicating a potential EUR/GBP bearish trend, while the Relative Strength Index (RSI) hovers around 47, suggesting neutral market sentiment with a slight bearish tendency. Traders should observe the pair’s reaction to today’s economic data, which could confirm or invalidate the current trend based on EUR and GBP strength in light of upcoming inflation and growth metrics.

    • DISCLAIMER: Please note that the above analysis is not an investment suggestion by “Capitalcore LLC”. This post has been published only for educational purposes.

    Capitalcore

  4. #94
    Junior Member Capitalcore's Avatar
    Join Date
    May 2024
    Posts
    97
    NZDUSD Fibonacci Levels Show Potential Rebound

    The NZD/USD currency pair, commonly referred to as the "Kiwi," represents the exchange rate between the New Zealand Dollar (NZD) and the United States Dollar (USD) and is influenced by economic indicators, monetary policies, and global trade dynamics, making it a popular choice for forex traders. Today, fundamental factors could drive significant price movements, with Federal Reserve Bank of Chicago President Austan Goolsbee’s remarks potentially signaling future monetary policy; hawkish tones may strengthen the USD, while dovish comments could weaken it. Additionally, the National Association of Home Builders (NAHB) Housing Market Index will provide insights into the US housing market outlook, impacting USD sentiment. On the NZD side, BusinessNZ’s Performance of Services Index will offer clues about service-sector expansion, and the release of Producer Price Index (PPI) data could indicate inflationary pressures in New Zealand. The G20 meeting also presents a global macroeconomic backdrop that may influence the Kiwi through risk sentiment shifts.

    Chart Notes:
    • Chart time-zone is UTC (+02:00)
    • Candles’ time-frame is 4h.

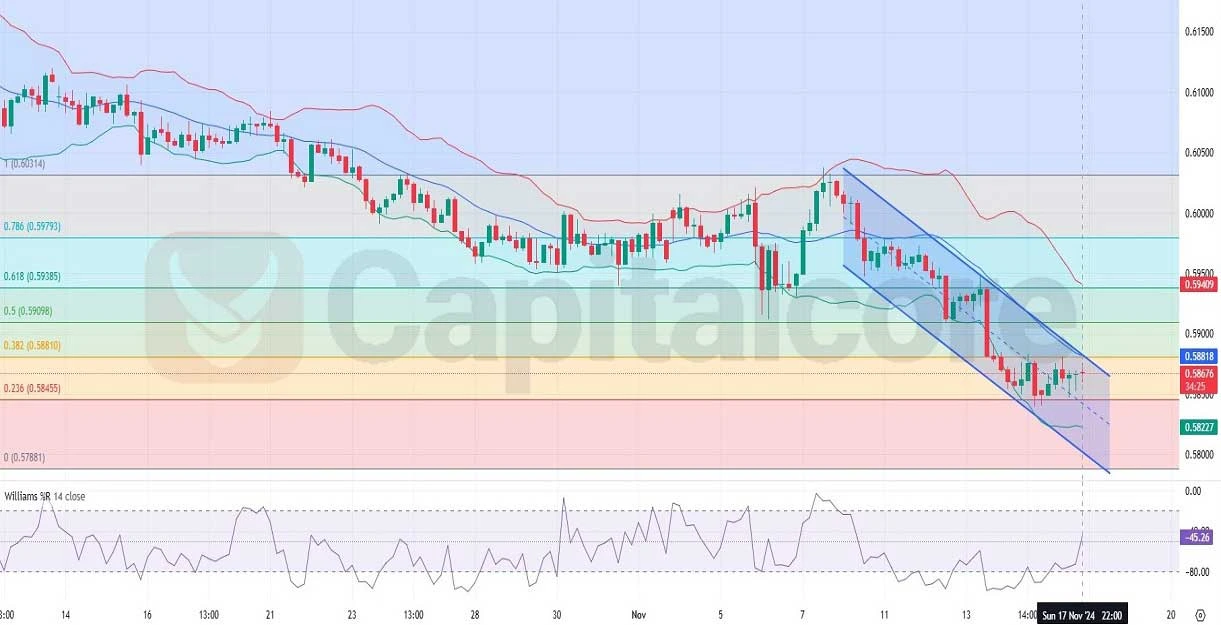
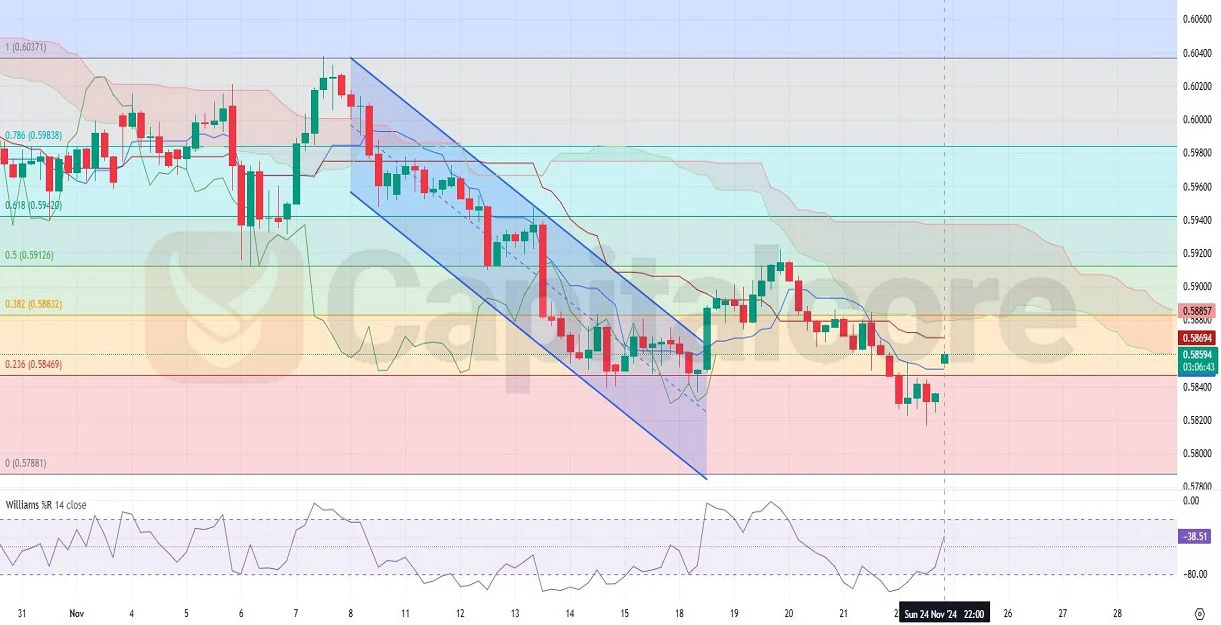
    Analyzing the H4 chart for NZD USD, the pair remains in a bearish trend within a descending channel, with candlesticks primarily moving in the lower half of the Bollinger Bands and frequently touching the lower band, confirming sustained downward pressure. Despite this, there is evidence of a short-term recovery as candles attempt to push from the lower band toward the middle band, a key resistance zone. The Fibonacci retracement levels indicate the price has bounced from the 0.236 level and is currently approaching the 0.382 level (around 0.58810), suggesting some consolidation or a potential minor correction within the broader downtrend. The Williams %R indicator, hovering near oversold levels, points to the possibility of a brief pullback, but bearish momentum remains intact unless the pair breaks above the middle Bollinger Band and sustains above the 0.382 Fibonacci level.

    •DISCLAIMER: Please note that the above analysis is not an investment suggestion by “Capitalcore LLC”. This post has been published only for educational purposes.

    Capitalcore

  5. #95
    Junior Member Capitalcore's Avatar
    Join Date
    May 2024
    Posts
    97
    Gold Prices at a Crucial Juncture

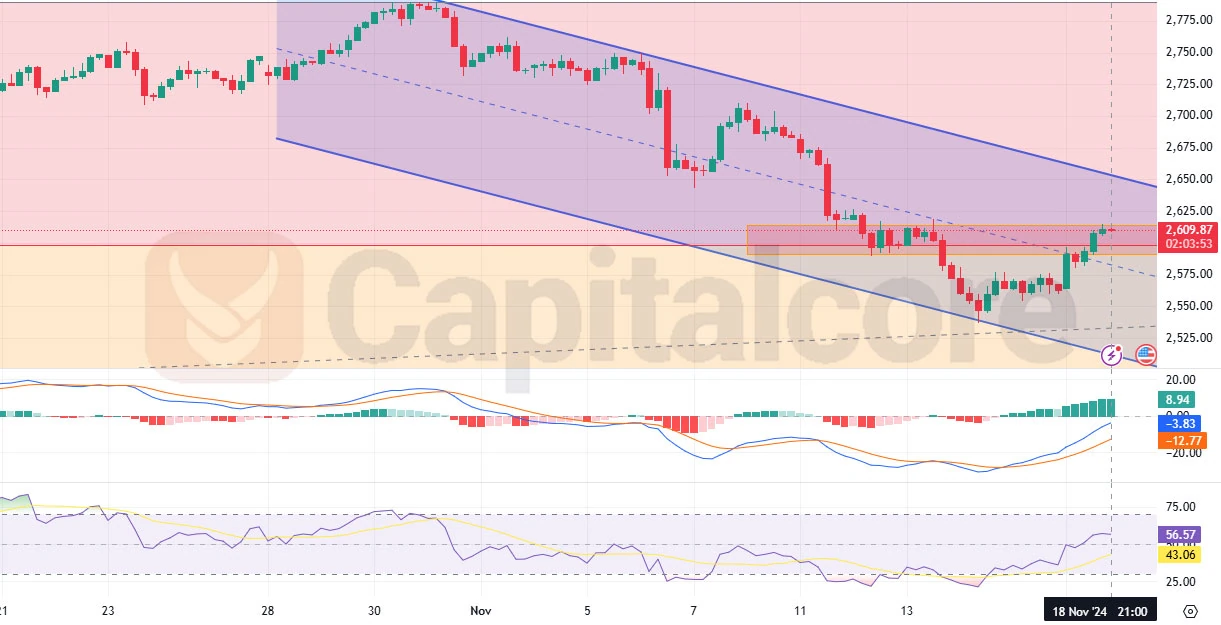
    The Gold (XAU/USD) market, often referred to as a safe-haven asset, represents a crucial indicator for global economic sentiment and is closely watched by traders during periods of uncertainty. Today, this pair is observed at a pivotal stage, encountering a strong resistance level at $2,600 while trading within a bearish channel. This situation marks an important point for potential price movements following a steady corrective phase amid broader bearish trends. The proximity to this resistance suggests the possibility of a decisive breakout or a continuation of the prevailing downtrend. Upon closer examination of the price action on the Gold chart, we can see that the price has been consolidating within the bearish channel, characterized by lower highs and lower lows. However, a strong buy signal has emerged in recent sessions. The MACD indicator underscores this perspective, with a bullish crossover and green histogram bars signaling increased buying momentum. Moreover, the RSI has climbed close to 60, highlighting strengthening bullish sentiment, though it is still below overbought levels, leaving room for additional upward movement.

    Chart Notes:
    • Chart time-zone is UTC (+02:00)
    • Candles’ time-frame is 4h.

    The key resistance level at $2,600 is currently being tested, with the next significant resistance located at $2,660. This setup creates a critical inflection point for Gold traders. A convincing break above the $2,600 level could pave the way for a continuation of the recovery, targeting the upper resistance at $2,660. However, failure to breach this resistance could result in a reversal and a potential retest of support levels around $2,550 or lower within the bearish channel. This combination of technical signals—particularly the bullish MACD crossover, increasing RSI, and proximity to resistance—strongly points toward a possible bullish breakout. Traders should monitor the $2,600 resistance level closely; a decisive break above this could affirm the potential for higher price levels, while a rejection may indicate a continuation of the bearish trend in the Gold market.

    •DISCLAIMER: Please note that the above analysis is not an investment suggestion by “Capitalcore LLC”. This post has been published only for educational purposes.

    Capitalcore

  6. #96
    Junior Member Capitalcore's Avatar
    Join Date
    May 2024
    Posts
    97
    GBP/USD H4 Chart Analysis: Bearish Channel Dominates


    The GBP/USD currency pair, often nicknamed "Cable," reflects the exchange rate between the British Pound and the US Dollar. As one of the most traded pairs in the forex market, it is influenced heavily by macroeconomic data, central bank policies, and global economic conditions.
    The GBP/USD fundamental analysis today suggests heightened volatility as several key economic indicators and events come into focus. For the GBP, the UK Consumer Price Index (CPI), including its core and retail components, is due, and its actual numbers exceeding forecasts could boost the pound due to inflationary pressures supporting a potential rate hike by the Bank of England. Additionally, BOE Deputy Governor David Ramsden's speech on monetary policy could provide clues about future interest rate trajectories. Meanwhile, on the USD side, Federal Reserve Governors Lisa Cook and Michelle Bowman will speak on monetary and economic policies, likely influencing the dollar's strength, especially if hawkish tones dominate. This mix of inflation data and high-level speeches could set the tone for Cable's forecast today, particularly as the pair struggles against bearish pressures.

    Chart Notes:
    • Chart time-zone is UTC (+03:00)
    • Candles’ time-frame is 4h.

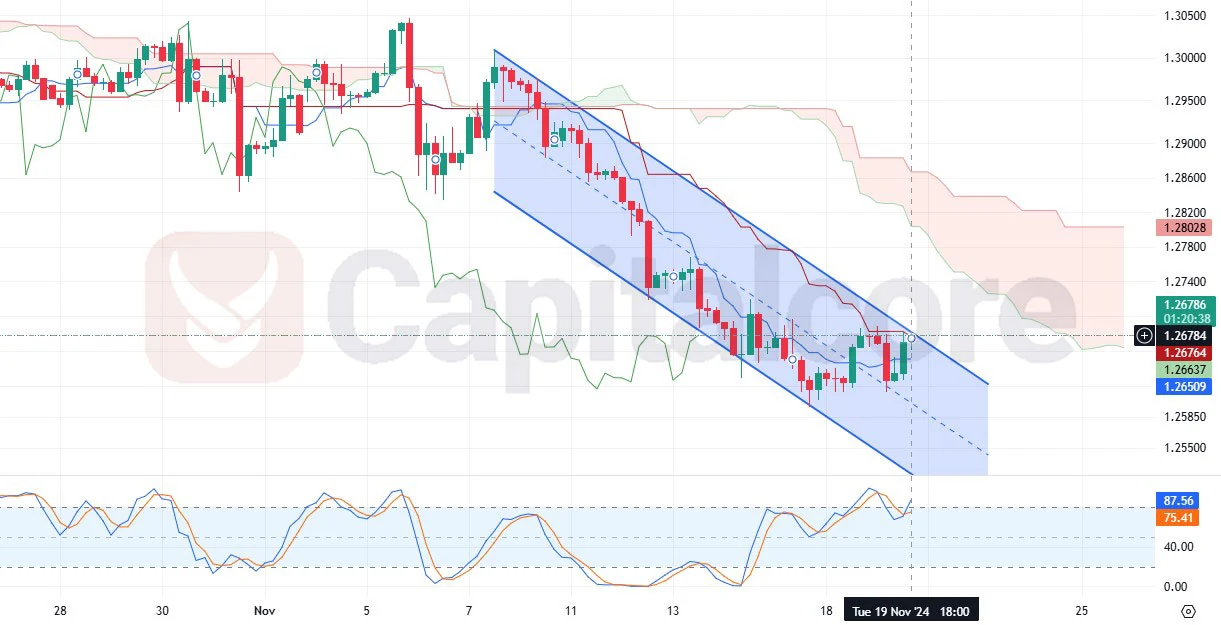
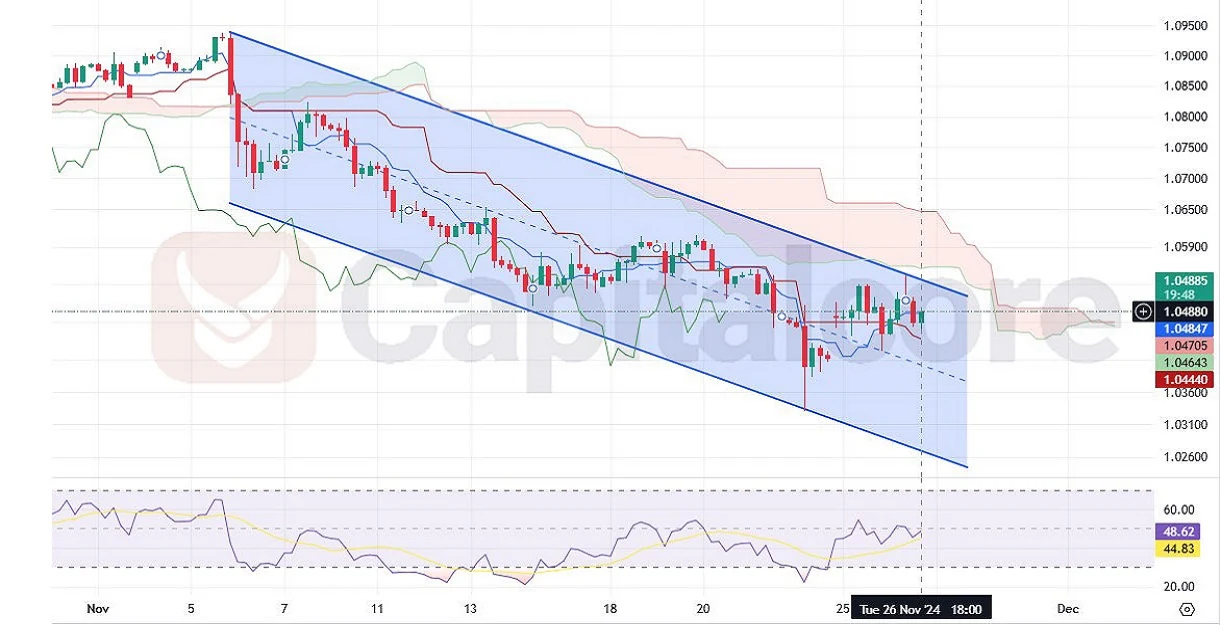
    The GBP/USD H4 chart shows that the pair is firmly entrenched in a bearish parallel channel, with prices trading below the Ichimoku Cloud, signaling a sustained GBPUSD bearish trend. Additionally, a recent crossover on the Stochastic RSI indicates bullish divergence in oversold territory, hinting at a potential short-term corrective bounce. However, the prevailing bearish structure within the channel remains intact, suggesting sellers are still dominant. The market's inability to break above the cloud or the upper boundary of the channel could reinforce the pair’s bearish sentiment and lead to a continuation of the downtrend. Traders should monitor key support at 1.2650 and resistance near the upper channel trendline for potential trade setups.


    • DISCLAIMER: Please note that the above analysis is not an investment suggestion by “Capitalcore LLC”. This post has been published only for educational purposes.

    Capitalcore

  7. #97
    Junior Member Capitalcore's Avatar
    Join Date
    May 2024
    Posts
    97
    USDJPY H4 Chart Insights and Price Action

    The USD JPY currency pair, often referred to by its nickname, the "Ninja," represents the dynamic relationship between the US Dollar (USD) and the Japanese Yen (JPY). Known for its liquidity and sensitivity to monetary policies, it is a popular choice among forex traders seeking volatility and trends.
    Today, the USDJPY is poised to respond to several critical events, including speeches from Federal Reserve officials like Susan Collins, Beth Hammack, and Austan Goolsbee. These speeches are expected to provide subtle cues on future US monetary policy, which could strengthen the USD if hawkish sentiments dominate. Additionally, US unemployment claims and the Philadelphia Fed Manufacturing Index will offer insights into labor market health and economic activity. On the JPY side, BOJ Governor Kazuo Ueda's speech could hint at any shifts in Japan’s ultra-loose monetary policy, further influencing the pair. Traders should watch for volatility, especially if Collins' or Hammack's comments diverge from expectations, potentially pushing USD JPY toward key support or resistance levels.

    Chart Notes:
    • Chart time-zone is UTC (+02:00)
    • Candles’ time-frame is 4h.

    The USD/JPY H4 chart displays a bullish trend, with the price currently trading above the Ichimoku cloud, a clear indication of upward momentum. Out of the last 10 candles, 6 are bullish, reinforcing the current positive sentiment. The price sits between the 0 and 0.236 Fibonacci retracement levels, suggesting potential room for further upside within this trend channel. The Williams %R indicator is hovering near the overbought zone, signaling a possible pullback or consolidation phase before another upward move. Traders should monitor the lower boundary of the channel for potential support and the upper boundary for breakout opportunities.

    •DISCLAIMER: Please note that the above analysis is not an investment suggestion by “Capitalcore LLC”. This post has been published only for educational purposes.

    Capitalcore

Page 10 of 10 FirstFirst ... 8 9 10

Bookmarks

Posting Permissions

  • You may not post new threads
  • You may not post replies
  • You may not post attachments
  • You may not edit your posts
  •