Page 6 of 6 FirstFirst ... 4 5 6
Results 51 to 58 of 58

Daily Market Forecast By Capitalcore

This is a discussion on Daily Market Forecast By Capitalcore within the Analytics and News forums, part of the Trading Forum category; NZDUSD Price Action Breaks Key Fibonacci Level The NZDUSD, commonly referred to as the “Kiwi,” is a major forex pair ...


  1. #51
    Junior Member Capitalcore's Avatar
    Join Date
    May 2024
    Posts
    58
    NZDUSD Price Action Breaks Key Fibonacci Level

    The NZDUSD, commonly referred to as the “Kiwi,” is a major forex pair consisting of the New Zealand Dollar (NZD) and the United States Dollar (USD). As a commodity currency pair, NZD/USD is influenced by global economic trends, commodity prices, and interest rate differentials. The pair is popular among traders for its liquidity and the potential for high volatility, often responding sharply to economic data and geopolitical developments.
    Today’s key economic events could significantly impact the NZDUSD pair, particularly any updates related to New Zealand's trade balance, which plays a critical role in the currency's valuation. Positive data from New Zealand could strengthen the Kiwi, while any negative sentiment from the US market could drive the NZD USD forex pair lower. Additionally, any changes in the Federal Reserve’s stance on interest rates could also lead to volatility, as traders assess the future path of monetary policy in the US. Market participants will closely monitor these developments, which could set the tone for short-term price movements in the NZDUSD forex pair.
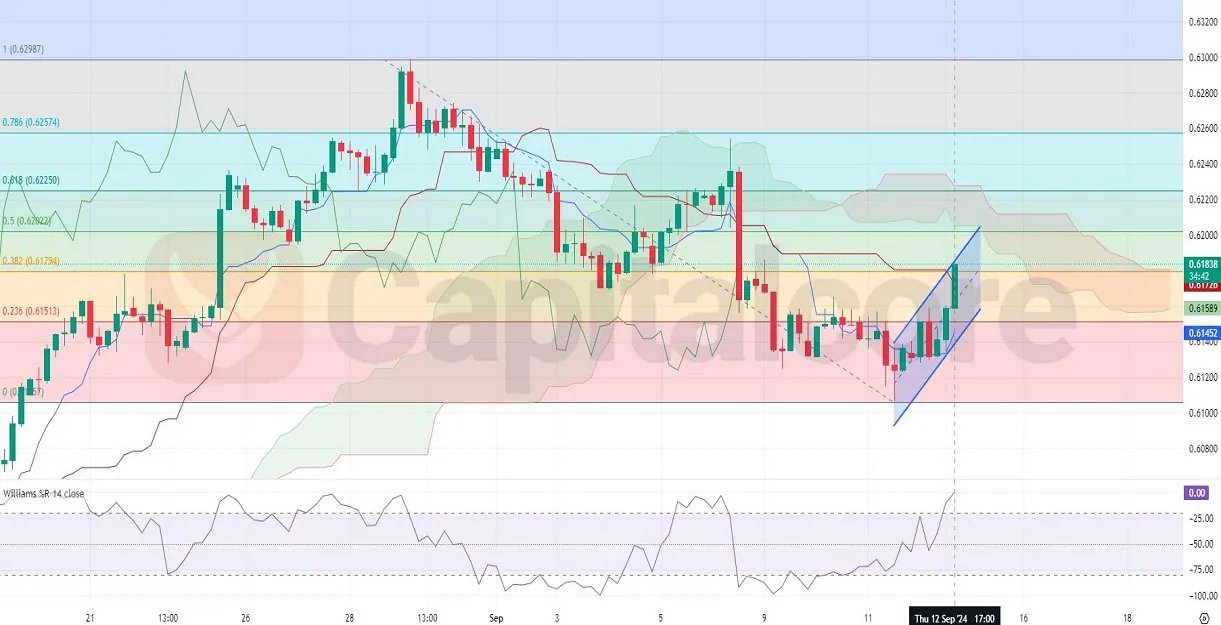
    Chart Notes:
    • Chart time-zone is UTC (+03:00)
    • Candles’ time-frame is 4h.

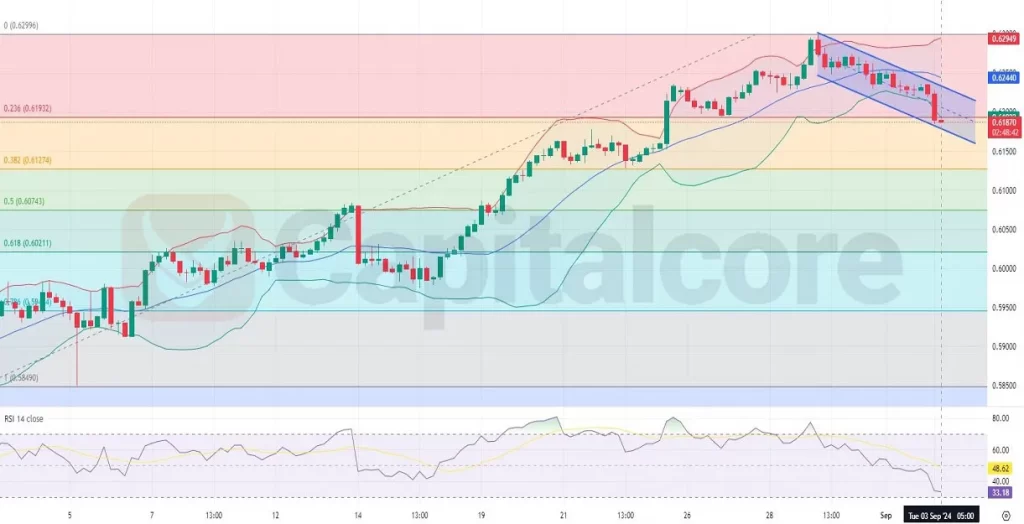
    The H4 chart of NZDUSD displays a clear bearish trend, with 13 out of the last 19 candles being bearish, including the most recent one. The price has moved from the upper Bollinger Band towards the middle band and then to the lower band, where it is currently hovering, indicating strong selling pressure. The expansion of the Bollinger Bands suggests increasing volatility, supporting the downward movement. The price has recently broken below the 0.236 Fibonacci retracement level and is now between the 0.382 Fibonacci level, highlighting a significant retracement from its recent highs. The RSI indicator is trending below 50 and approaching oversold territory, currently around 33.18, suggesting that while the bearish momentum is strong, there might be a potential for a short-term correction or consolidation before continuing its downward trajectory.

    • DISCLAIMER: Please note that the above analysis is not an investment suggestion by “Capitalcore LLC”. This post has been published only for educational purposes.

    Capitalcore

  2. #52
    Junior Member Capitalcore's Avatar
    Join Date
    May 2024
    Posts
    58
    AUDUSD bullish reversal on the H4 chart

    The AUD/USD currency pair, also known as the "Aussie," is one of the most traded forex pairs, representing the strength and dynamics of the Australian dollar against the US dollar. With Australia being a resource-rich economy and the US being the world’s largest economy, the AUD USD pair is influenced by commodity prices, interest rate differentials, and overall market risk sentiment. Today, the market's attention is focused on the upcoming news from the Australian Bureau of Statistics regarding trade balance, as well as speeches by RBA Governor Michele Bullock, which may offer clues on future monetary policy. Additionally, key USD economic indicators, such as job cuts and labor market data, will further impact the direction of this pair. If Australia’s export data beats expectations or the RBA signals hawkish intentions, the Aussie could strengthen, while weak US labor data could also support a rise in AUD/USD.

    Chart Notes:
    • Chart time-zone is UTC (+03:00)
    • Candles’ time-frame is 4h.

    Analyzing the AUD/USD H4 chart, we see several technical factors at play. The pair has been in a clear downtrend, moving from the 0 Fibonacci level down to below the 0.236 Fibonacci retracement level. However, the recent Aussie’s price action shows a recovery, with four out of the last five candles being positive, pushing the price above the 0.236 Fibonacci level. If this momentum continues, AUD/USD could aim to return to the 0 Fibonacci level. In terms of Ichimoku, the price dropped below the cloud but is now making an effort to re-enter and test it, indicating potential bullish momentum. Additionally, the MACD is showing signs of a possible bullish crossover, supported by a decreasing bearish histogram, which could signal further upward movement in the short term for AUD USD forex pair.

    • DISCLAIMER: Please note that the above analysis is not an investment suggestion by “Capitalcore LLC”. This post has been published only for educational purposes.

    Capitalcore

  3. #53
    Junior Member Capitalcore's Avatar
    Join Date
    May 2024
    Posts
    58
    EURUSD H4 RSI and Fibonacci Levels in Focus

    EUR/USD forex pair, often referred to as "Fiber," is one of the most traded currency pairs in the Forex market, reflecting the value of the Euro against the U.S. Dollar. This pair is highly influenced by the economic and political events in both the Eurozone and the United States, making it a vital indicator of the global economy's health. Today’s upcoming news includes significant economic reports from both the Eurozone and the U.S., which are expected to impact the direction of EUR/USD price.
    From a fundamental perspective, key reports from the Eurozone, such as industrial output, foreign trade balance, and employment data, will be essential to monitor. Better-than-expected results could strengthen the Euro, especially if industrial output and foreign trade data outperform forecasts, indicating robust economic health. On the U.S. side, the upcoming Non-Farm Payrolls (NFP) and unemployment rate data are likely to dictate the market's sentiment toward the U.S. Dollar. A positive NFP figure would indicate a stronger labor market, potentially boosting the Dollar. Additionally, speeches from key Federal Reserve officials, like John Williams and Christopher Waller, may provide clues on future U.S. monetary policy. Any hints of further interest rate hikes could support the Dollar, pressuring the EUR/USD lower.


    Chart Notes:
    • Chart time-zone is UTC (+03:00)
    • Candles’ time-frame is 4h.

    In the technical analysis based on the EUR/USD H4 chart, the pair is showing a clear uptrend, supported by the last three bullish candles. The price is currently moving from the middle Bollinger Band toward the upper band, even touching the upper line. This suggests increasing volatility and a possible continuation of the upward movement. Additionally, the price has moved from the 0.382 Fibonacci retracement level to the 0.236 level and is now hovering near this point, showing potential to rise further toward the 0.0 Fibonacci retracement level. The Bollinger Bands are widening, indicating higher market volatility, while the RSI is gradually climbing, signaling further bullish momentum. If the price breaks the 0.236 Fibonacci level convincingly, the next target could be the 0.0 Fibonacci level around 1.12029, with strong support at the 1.1050 region.

    • DISCLAIMER: Please note that the above analysis is not an investment suggestion by “Capitalcore LLC”. This post has been published only for educational purposes.

    Capitalcore

  4. #54
    Junior Member Capitalcore's Avatar
    Join Date
    May 2024
    Posts
    58
    USDJPY Technical Analysis Hints at Further Losses

    The USDJPY forex pair, commonly referred to as "The Ninja," is known for its volatility and is a major currency pair in the global foreign exchange market. It represents the strength of the US Dollar (USD) against the Japanese Yen (JPY), making it sensitive to economic indicators from both Japan and the United States. As of today, traders are eyeing key economic data from Japan, including the Bank of Japan’s release on outstanding loans, the current account figures from the Ministry of Finance, and quarterly GDP data, all of which can influence the JPY. In the US, wholesale inventories and consumer credit data are expected, potentially impacting the USD. These reports, especially the GDP and loan data, could cause fluctuations in the USDJPY, as they reflect consumer confidence and economic growth in Japan, while inventory data may signal shifts in business spending in the US.

    Chart Notes:
    • Chart time-zone is UTC (+03:00)
    • Candles’ time-frame is 4h.

    Analyzing the USDJPY H4 chart, we see a clear bearish trend, reinforced by the price being below the Ichimoku cloud, a strong indicator of downward momentum. The recent Fibonacci retracement levels further highlight the price’s fall below the 0.786 level, which suggests that a deeper retracement might be underway. The chart shows that 7 of the last 10 candles are bearish, with the last three continuing this pattern, signaling strong selling pressure. The RSI indicator is also trending lower, currently below 30, which suggests oversold conditions, though there may still be room for further downside movement. Overall, the USDJPY’s technical indicators point to continued bearish momentum in the short term, with potential support around the 1 Fibonacci level.

    • DISCLAIMER: Please note that the above analysis is not an investment suggestion by “Capitalcore LLC”. This post has been published only for educational purposes.

    Capitalcore

  5. #55
    Junior Member Capitalcore's Avatar
    Join Date
    May 2024
    Posts
    58
    Bearish Pressure Mounts on EUR/GBP

    The EUR/GBP, often referred to as the "Chunnel," represents the exchange rate between the Euro and the British Pound, two of Europe's most widely traded currencies. Currently, this pair is facing bearish pressure as it tests a descending trendline on the H4 chart. MACD signals are weakening, with the histogram declining and the signal line converging near the MACD line. Additionally, the RSI stands at 56.59, showing a neutral position but with a declining bullish slope. The recent price action hints at the potential for a bearish wave if the bullish trendline below the current price of 0.84422 fails to hold.

    Chart Notes:
    • Chart time-zone is UTC (+03:00)
    • Candles’ time-frame is 4h.

    Upcoming economic data for both the Eurozone and the UK are key factors that could shift the market's predictions. With German Final CPI expected at -0.1% and UK employment data, including the Claimant Count Change and Unemployment Rate, traders should watch closely. A break below the bullish trendline could lead to increased bearish momentum, favoring sellers, while a hold above this level might provide temporary support for the bulls, though technical indicators currently suggest a bearish bias.

    • DISCLAIMER: Please note that the above analysis is not an investment suggestion by “Capitalcore LLC”. This post has been published only for educational purposes.

    Capitalcore

  6. #56
    Junior Member Capitalcore's Avatar
    Join Date
    May 2024
    Posts
    58
    EURUSD H4 Chart Analysis with MACD and Fibonacci

    The EUR/USD forex pair, often referred to as "Fiber," is one of the most actively traded currency pairs in the forex market, representing the economies of the European Union and the United States. Its liquidity and volatility make it a favorite among traders, especially during times of major economic releases from either region. Today, key European and US data, such as the Eurozone Wholesale Price Index and the US Producer Price Index (PPI), will be the focal points, offering insights into inflationary pressures in both economies. Higher-than-expected PPI or Wholesale Price Index results could signal potential price increases passed on to consumers, impacting inflation and potentially affecting ECB or Fed rate decisions.
    Fundamentally, the euro currency may see significant movement today, driven by the Wholesale Price Index (WPI) in the Eurozone and unemployment data from Istat, both of which indicate the broader economic health. Rising wholesale prices could further strain inflationary pressures, making the ECB's monetary policy increasingly important. On the US side, PPI data is crucial as it could signal inflationary changes, prompting traders to look for clues about the Fed’s future rate hikes. With the recent ECB decisions on rates and the looming US data, volatility is expected, especially if the data deviates significantly from forecasts.

    Chart Notes:
    • Chart time-zone is UTC (+03:00)
    • Candles’ time-frame is 4h.

    The EUR/USD H4 chart displays a clear downtrend, as the price has been consistently bearish over the past four candles. It has descended from the upper Bollinger Band and is now hovering between the middle and lower bands, indicating increasing bearish pressure. The Bollinger Bands have widened slightly, suggesting potential for further price movement, with volatility picking up. The Fibonacci retracement levels show that the price is fluctuating between the 0.382 and 0.5 levels, highlighting a potential support area near the 1.09116 level. However, the MACD indicator shows bearish momentum, as the histogram bars are increasing in the negative region, signaling that the price could continue its downward movement.
    As the Fiber price approaches the lower bands and key Fibonacci levels, traders should watch for a break below the 1.09116 level, which could trigger further selling pressure. However, a reversal near the middle Bollinger Band could suggest consolidation or potential bullish recovery if it holds support at the 0.5 Fibonacci level.

    • DISCLAIMER: Please note that the above analysis is not an investment suggestion by “Capitalcore LLC”. This post has been published only for educational purposes.

    Capitalcore

  7. #57
    Junior Member Capitalcore's Avatar
    Join Date
    May 2024
    Posts
    58
    NZDUSD H4 Trading Strategy and Key Zones

    The NZD/USD currency pair, often referred to by its nickname "Kiwi," is a popular pair in the forex market, representing the exchange rate between the New Zealand Dollar and the US Dollar. Traders and investors follow it closely due to New Zealand's commodity-based economy and the US Dollar's status as the world's reserve currency. Upcoming economic reports from both countries, including New Zealand's Performance of Manufacturing Index and the US Import Price Index and consumer sentiment from the University of Michigan, will likely influence market movements today.
    Fundamentally, traders are paying attention to the US Import Price Index, which could indicate inflationary pressures, and the University of Michigan's consumer sentiment and inflation expectations, which provide insights into consumer spending and inflation outlooks. A higher-than-expected reading for both reports would be bullish for the USD, potentially pushing NZD/USD downward. However, New Zealand's PMI, if it shows expansion, could support the Kiwi, creating mixed signals for the pair. Traders should watch these reports as they will directly impact the pair's short-term direction, especially as inflation data becomes more critical in the context of central bank policies.

    Chart Notes:
    • Chart time-zone is UTC (+03:00)
    • Candles’ time-frame is 4h.

    Technically, the NZD/USD H4 chart shows a bullish momentum building, as the pair is moving towards the Ichimoku cloud but still trades below it. The last three candles have been bullish, with the price currently sitting around the 0.382 Fibonacci retracement level. If the price can break above this level, there is potential for it to reach the 0.5 or 0.618 Fibonacci levels. The Williams %R indicator shows that the pair may be overbought in the short term, signaling possible resistance ahead. Traders should watch how the price reacts to the 0.382 Fibonacci level as it will dictate the next move upward or a possible retracement.

    • DISCLAIMER: Please note that the above analysis is not an investment suggestion by “Capitalcore LLC”. This post has been published only for educational purposes.

    Capitalcore

  8. #58
    Junior Member Capitalcore's Avatar
    Join Date
    May 2024
    Posts
    58
    USDJPY bearish trend continues on H4 chart

    USD/JPY forex pair, also known as the "Gopher," is one of the most traded forex pairs globally, reflecting the relationship between the U.S. dollar and the Japanese yen. The pair is highly sensitive to market sentiment, risk appetite, and economic developments in both the U.S. and Japan. Today’s economic landscape is shaped by the upcoming release of the New York Manufacturing Index from the U.S., which serves as a leading indicator of economic health. If the actual index is higher than forecasted, it will support the dollar, signaling improving business conditions. However, due to the closure of Japanese banks for Respect-for-the-Aged Day, market liquidity could be low, leading to irregular volatility and a higher influence of speculators.

    Chart Notes:
    • Chart time-zone is UTC (+03:00)
    • Candles’ time-frame is 4h.

    Analyzing the USD/JPY H4 chart, the price is currently trading below the Ichimoku cloud, indicating bearish momentum. The cloud has widened, suggesting the potential for a stronger downtrend, though the last four candles show a slight bullish correction. The price is fluctuating between the 0.786 and 1 Fibonacci levels, having corrected slightly after touching the 1 level. The MACD shows a weak bullish divergence, but the histogram remains negative, signaling that any bullish momentum may be short-lived. Overall, the trend remains bearish, and further declines are expected after this minor correction.

    • DISCLAIMER: Please note that the above analysis is not an investment suggestion by “Capitalcore LLC”. This post has been published only for educational purposes.

    Capitalcore

Page 6 of 6 FirstFirst ... 4 5 6

Bookmarks

Posting Permissions

  • You may not post new threads
  • You may not post replies
  • You may not post attachments
  • You may not edit your posts
  •