
 LinkBack URL
 About LinkBacks


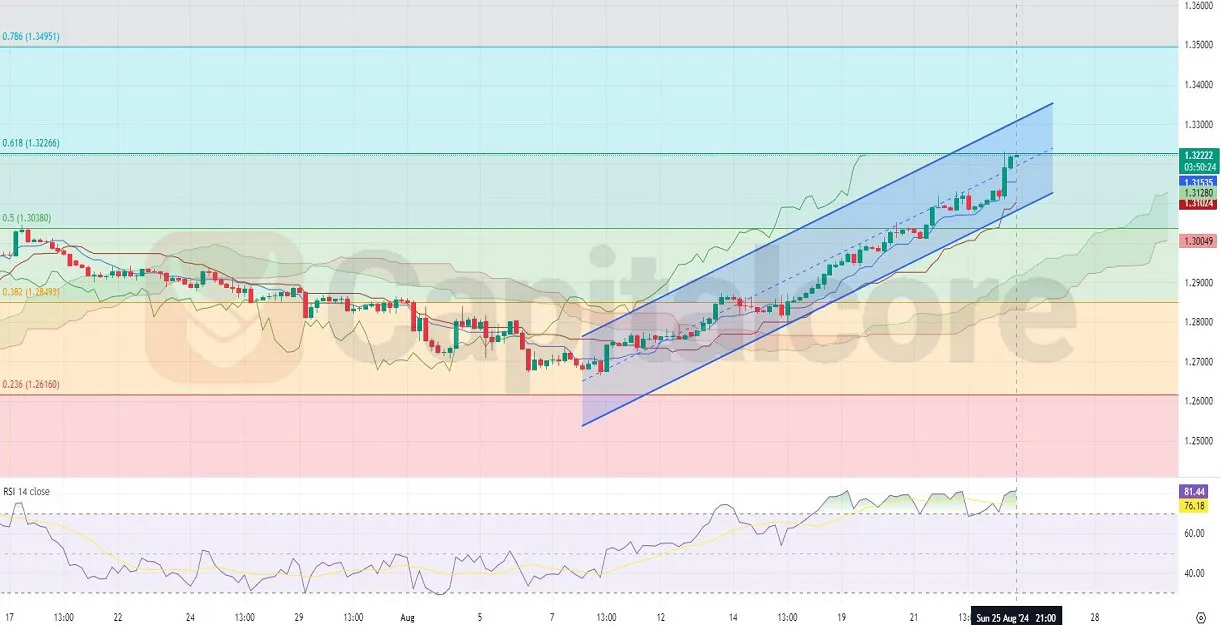
Navigating GBP/USD with Technical Indicators
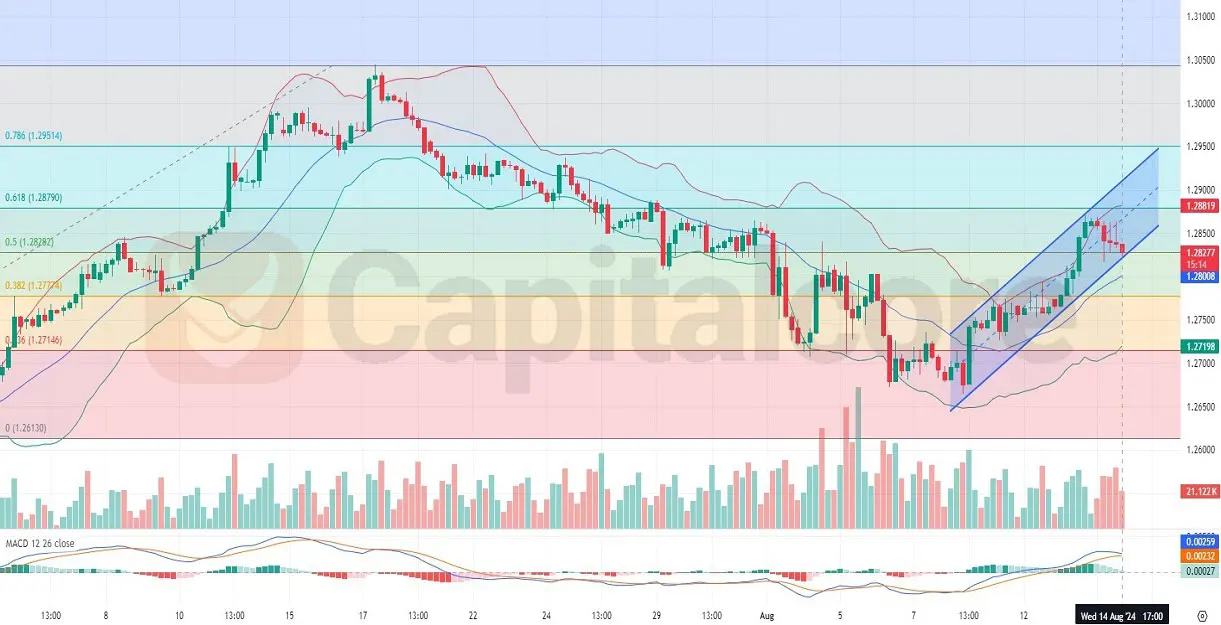
The GBP/USD forex pair, often referred to as "Cable," is a significant currency pair in the forex market, representing the exchange rate between the British pound sterling and the US dollar. Today, traders are closely monitoring a series of economic data releases from the UK, including GDP, trade balance, and manufacturing production figures. These indicators will provide insights into the UK's economic health, with higher-than-expected figures likely to bolster the pound, especially in light of ongoing concerns about the strength of the US dollar due to mixed economic signals from the US, including retail sales and jobless claims data.
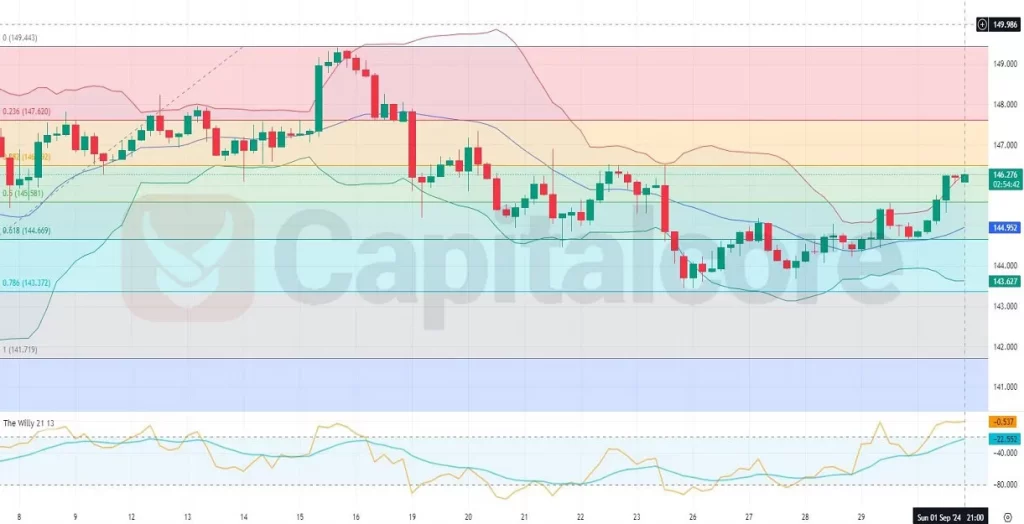
Chart Notes:
Chart time-zone is UTC (+03:00)
Candles time-frame is 4h.
The H4 chart of GBP/USD pair reveals a complex technical scenario. The pair is currently navigating within a rising channel, though recent price action has seen a retracement from the upper Bollinger Band towards the middle band. This correction is evident after a sequence of five consecutive bearish candles. Despite this pullback, the price remains in an overall bullish trend, trading above key Fibonacci retracement levels between 0.618 (1.28790) and 0.5 (1.28292), which are acting as crucial support and resistance. The MACD histogram is showing signs of weakening momentum, but as long as the price stays within the rising channel and above the 0.618 Fibonacci level, the bullish outlook remains intact. However, a break below the lower channel line could signal a potential shift in market sentiment.
DISCLAIMER: Please note that the above analysis is not an investment suggestion by Capitalcore LLC. This post has been published only for educational purposes.
Capitalcore


 Reply With Quote


Bookmarks