
 LinkBack URL
 About LinkBacks


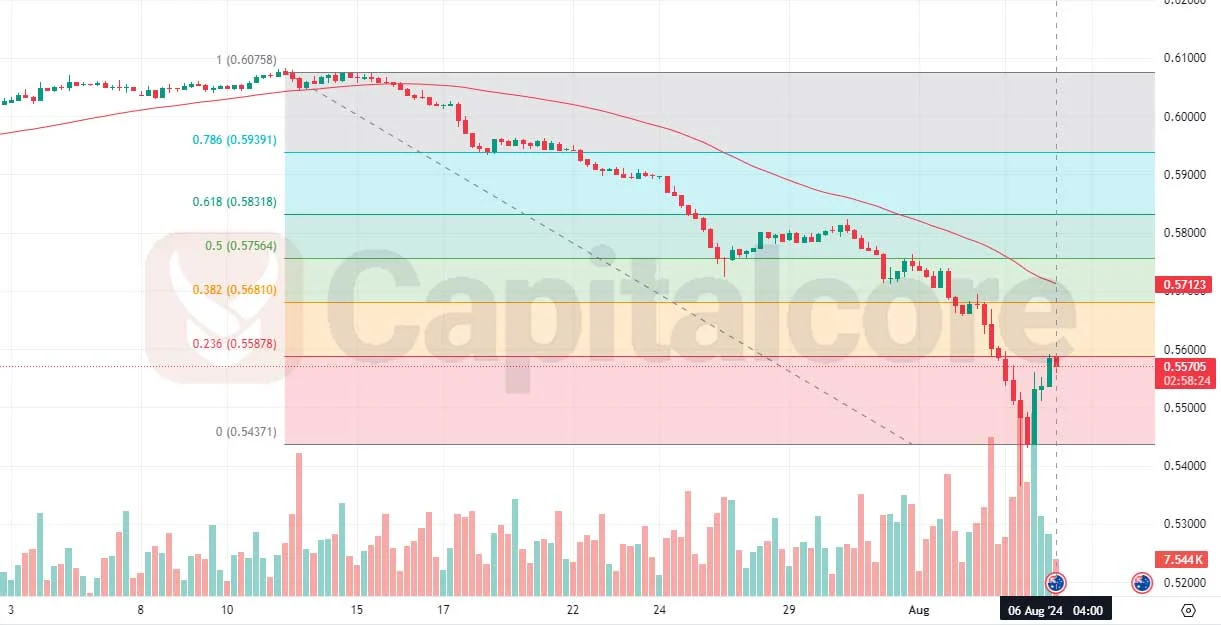
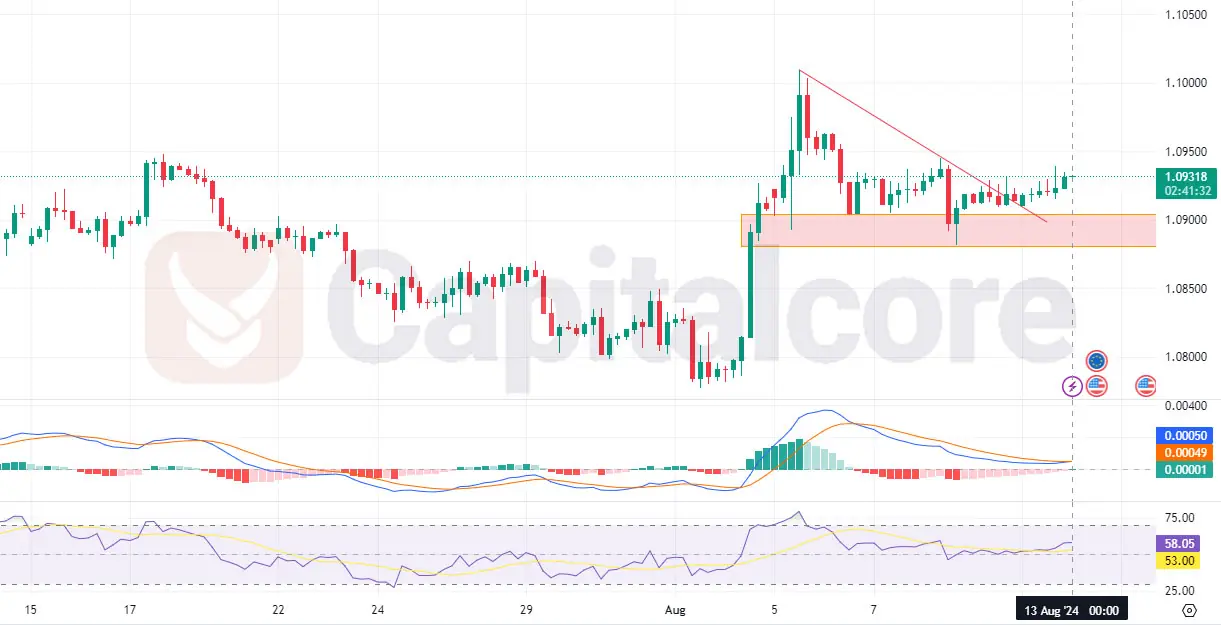
Current Market Sentiment and Technicals on AUD/USD H4 Chart
The AUD/USD forex pair, often referred to by its nickname Aussie, is a popular currency pair in the forex market, representing the exchange rate between the Australian Dollar (AUD) and the United States Dollar (USD). This pair is influenced by various economic factors, including interest rates, commodity prices, and economic data from both Australia and the United States. Today, the focus will be on several key economic indicators from the U.S. which may impact the AUD/USD pair.
The U.S. Core PCE Price Index m/m is forecasted at 0.2%, indicating a potential influence on inflation expectations and monetary policy decisions by the Federal Reserve. A lower-than-forecast result could weaken the USD, providing some support to the AUD. Additionally, Personal Income and Personal Spending data, forecasted at 0.4% and 0.3% respectively, will give insights into consumer health and economic activity. The Revised University of Michigan Consumer Sentiment and Inflation Expectations are also crucial, as they reflect consumer confidence and inflation outlook. Any deviation from forecasts in these data points could lead to significant movements in the AUD/USD pair. Moreover, the ongoing G20 meetings may introduce additional volatility, as global economic policies and issues are discussed, potentially impacting currency markets.
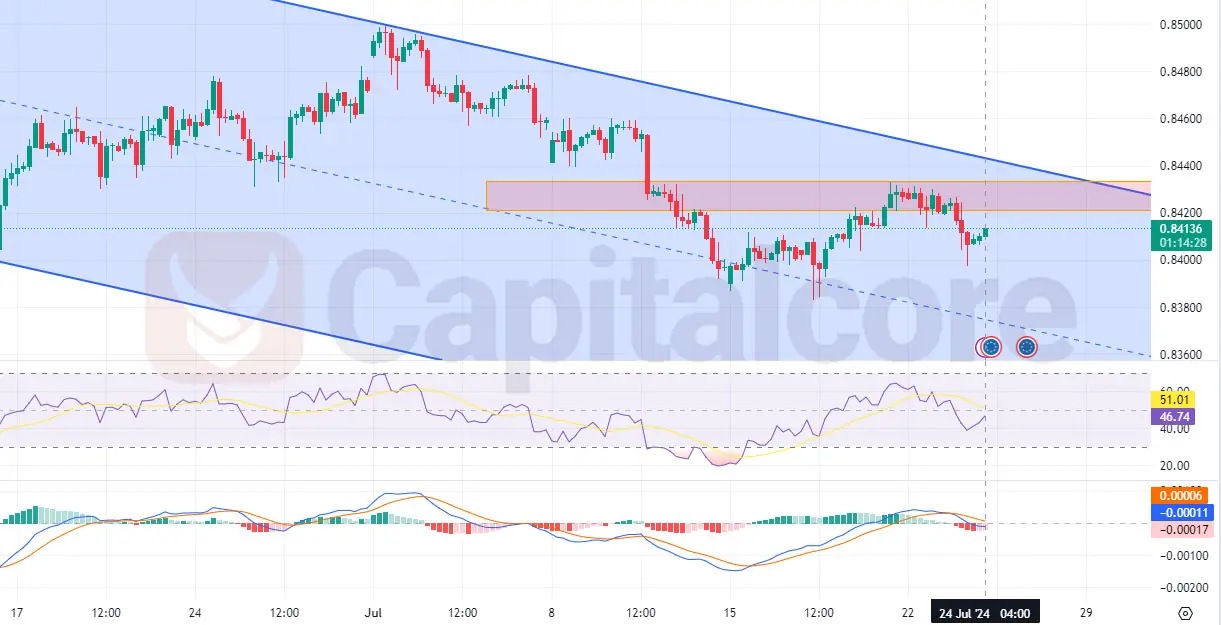
Chart Notes:
Chart time-zone is UTC (+03:00)
Candles time-frame is 4h.
The H4 chart of AUD/USD shows a strong bearish trend, characterized by a series of red candles over the past few days, with only a few bullish interruptions. The price has consistently moved within the lower half of the Bollinger Bands, often touching or staying close to the lower band, indicating strong downward momentum. Despite the bands widening, indicating increased volatility, the price has failed to reach the middle band, reinforcing the bearish outlook in the AUDUSD price. The MACD and histogram also support this bearish trend, showing a downward trajectory. The Fibonacci retracement levels have not significantly stopped the downtrend, serving only as minor resistance points. After touching the 1.0 Fibonacci level, the price experienced a brief bullish correction, but the most recent candle has turned bearish again, suggesting that the downtrend may continue.
DISCLAIMER: Please note that the above analysis is not an investment suggestion by Capitalcore LLC. This post has been published only for educational purposes.
Capitalcore


 Reply With Quote


Bookmarks