Page 31 of 32 FirstFirst ... 21 29 30 31 32 LastLast
Results 301 to 310 of 313
Like Tree4Likes

Daily Forex Analysis By FXGlory

This is a discussion on Daily Forex Analysis By FXGlory within the Analytics and News forums, part of the Trading Forum category; USDJPY H4 Technical and Fundamental Analysis for 08.15.2025 Time Zone: GMT +3 Time Frame: 4 Hours (H4) Fundamental Analysis The ...


  1. #301
    Senior Member FXGlory Ltd's Avatar
    Join Date
    Mar 2024
    Posts
    314

    Visit FXGlory Ltd's Youtube Channel
    USDJPY H4 Technical and Fundamental Analysis for 08.15.2025


    Time Zone: GMT +3
    Time Frame: 4 Hours (H4)


    Fundamental Analysis
    The USD/JPY currency pair is currently influenced by a packed economic calendar for both the United States and Japan. For the JPY, traders are watching today’s GDP Deflator, Real GDP, and Industrial Production data from the Cabinet Office and METI. Stronger-than-expected Japanese growth or production figures may bolster the Yen by raising the prospect of tighter Bank of Japan policy. On the USD side, key data releases include Retail Sales, Core Retail Sales, Empire State Manufacturing Index, Import Price Index, Capacity Utilization, Industrial Production, and University of Michigan Consumer Sentiment. Positive results across these indicators would strengthen the USD by supporting a hawkish Federal Reserve stance, while weaker outcomes could dampen dollar demand. Given the heavy data flow, volatility in USDJPY is likely to remain elevated throughout the session.


    Price Action
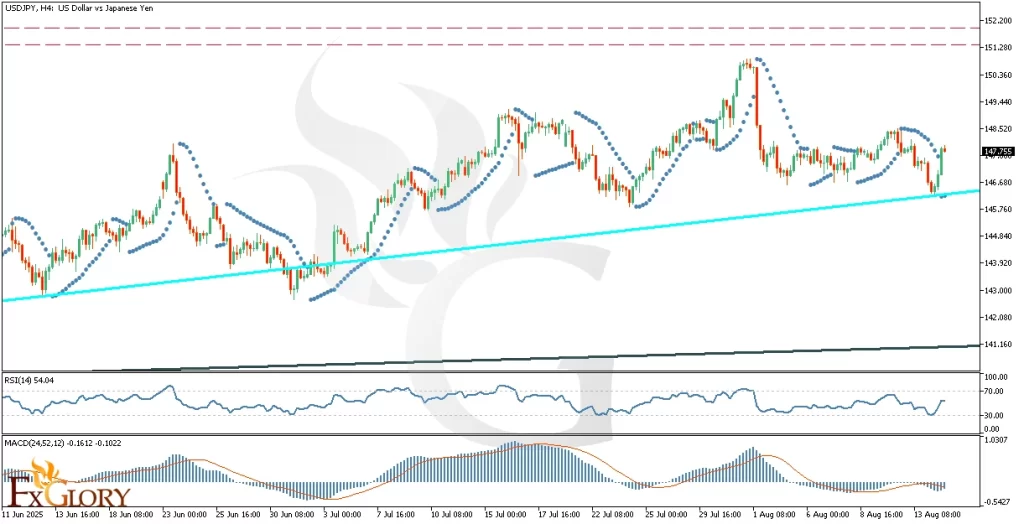
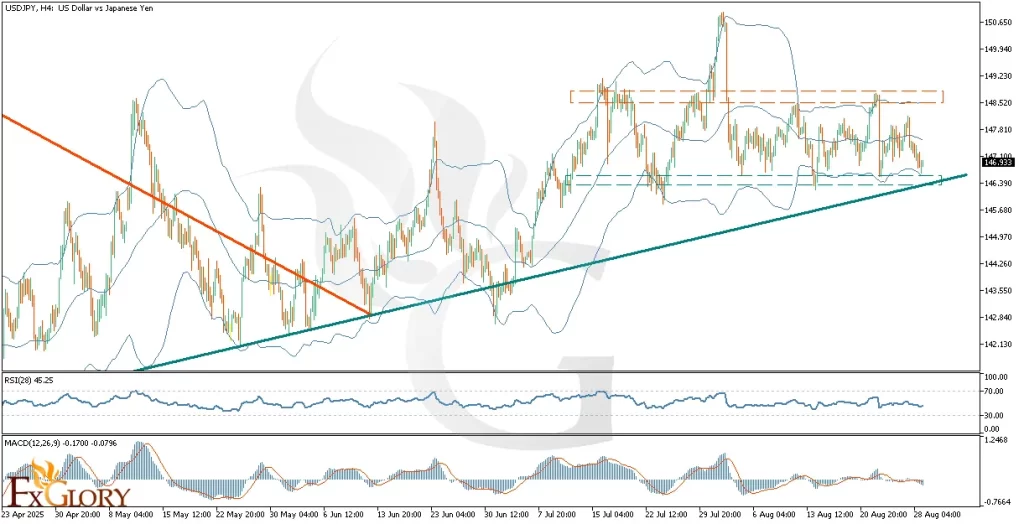
    On the H4 timeframe, USD-JPY has been trending upward since mid-June 2025, respecting a strong ascending trendline. The pair recently tested this dynamic support at 146.70 and bounced higher, signaling renewed bullish pressure. This rebound keeps the sequence of higher highs and higher lows intact, pointing toward a possible move toward 151.60 in the medium term. The recent pullback appears corrective in nature, and the recovery suggests bullish continuation remains the dominant scenario.


    Key Technical Indicators
    Parabolic SAR:
    The most recent Parabolic SAR dots have flipped above the price and are widening, indicating that the prior bearish momentum is losing steam and that a bullish reversal is taking shape as the market reclaims the trendline.
    RSI (14): Currently at 54.04, the RSI has broken above the neutral 50 level from below, reflecting improving bullish momentum. This position still leaves room before reaching the overbought threshold (70), which supports the potential for further upside.
    MACD (24,52,12): The MACD line at -0.1612 and the signal line at -0.1022 remain in negative territory but are converging. This narrowing gap suggests weakening bearish momentum, and a bullish crossover could confirm the next leg higher toward the 151.60 resistance.


    Support and Resistance
    Support: Immediate support is located at 146.700, which aligns with the ascending trendline and a recent price rebound zone. A deeper correction could find the next support at 145.750, matching a previous consolidation area.
    Resistance: The nearest resistance level is at 149.450, which coincides with the last swing high before the recent retracement. A sustained breakout above this level could open the way toward 151.600, a key long-term resistance zone and previous peak.


    Conclusion and Consideration
    The USDJPY H4 chart remains structurally bullish, with price respecting the ascending trendline and indicators signaling potential momentum recovery. RSI’s move above 50, the Parabolic SAR shift, and MACD’s potential bullish crossover all align with the possibility of an advance toward 149.45 and, if broken, the 151.60 resistance. However, today’s multiple high-impact data releases from both the US and Japan could trigger sharp intraday swings. Traders should manage positions carefully and consider volatility when setting stop-loss and take-profit levels.


    Disclaimer: The analysis provided for USD/JPY is for informational purposes only and does not constitute investment advice. Traders are encouraged to perform their own analysis and research before making any trading decisions on USDJPY. Market conditions can change quickly, so staying informed with the latest data is essential.


    FXGlory
    08.15.2025

  2. #302
    Senior Member FXGlory Ltd's Avatar
    Join Date
    Mar 2024
    Posts
    314

    Visit FXGlory Ltd's Youtube Channel
    NZDUSD H4 Technical and Fundamental Analysis for 08.19.2025


    Time Zone: GMT +3
    Time Frame: 4 Hours (H4)


    Fundamental Analysis
    The NZDUSD pair remains sensitive to both New Zealand domestic data and US macro/newsflow. On the NZD side, upcoming Producer Price Index (PPI) releases and the twice-monthly GlobalDairyTrade (GDT) auction are relevant — stronger-than-expected PPI or higher dairy auction prices would support the NZD via inflation and export-income channels. For the USD, headline events this week include monthly Residential Building Permits and Housing Starts (Census Bureau), Federal Reserve Governor Michelle Bowman speaking (possible hawkish cues), and weekly API/EIA energy reports; stronger housing or hawkish Fed commentary typically strengthens the USD and can push NZD-USD lower. Overall, the macro backdrop currently favours risk-off/skittish flows into the USD if US prints surprise to the upside, while NZD remains vulnerable to commodity and PPI surprises.


    Price Action
    The H4 price action shows the pair entrenched in a long-term downtrend with a clear sequence of lower highs and lower lows. Recently the market has been consolidating between the nearest support area around 0.58934 and short-term resistance near 0.59547, forming a shallow range after a bearish impulse. Candles are trading below the moving average line, which is acting as dynamic resistance; failed attempts to close above 0.59547 point to sellers defending the earlier resistance line. Given the structure, any upward retracement would first test 0.59547 and then the long-term descending resistance near 0.61180, while renewed selling pressure risks a drop back to 0.58934 and ultimately the historical support zone around 0.56602.


    Key Technical Indicators
    Moving Average (9): Price is trading below the H4 moving average, which is sloping downward and acting as dynamic resistance, rallies have been capped at the MA. Until price closes convincingly above the MA, expect sellers to remain in control and treat rallies as shorting opportunities.
    RSI (14): Momentum is mildly bearish but not extreme, sitting around 43.78, which is below the 50 midpoint yet far from oversold. This leaves room for further downside while still allowing for a retracement if RSI moves back above 50.
    MACD (12,26,9): Momentum is weak with the MACD and signal lines nearly overlapping (MACD ≈ -0.000558, Signal ≈ -0.000541), yielding a small negative histogram. Wait for a clear crossover or histogram expansion aligned with price structure before taking directional trades.


    Support and Resistance
    Support: Near-term support sits at 0.58934, the recent swing low and short-term demand zone where buyers previously defended prices, with a deeper structural floor at 0.56602 that would act as the next major support if selling intensifies.
    Resistance: Immediate resistance is at 0.59547, a congestion zone and the first upside hurdle for any retracement, while the long-term descending trendline around 0.61180 represents the larger supply area that must be cleared to shift the bearish bias.


    Conclusion and Consideration
    NZD/USD on the H4 timeframe remains in a structural downtrend; technical indicators (MA, RSI, MACD) all lean mildly bearish to neutral and the pair is consolidating under the moving average. Shorter intraday traders can look for reliable setups near the 0.58934 support for counter-trend scalps with tight stops, but trend-following traders should favour short opportunities on rallies toward 0.59547 or the dynamic MA, targeting a move back toward 0.58934 and, if momentum accelerates, 0.56602. Fundamental catalysts (US Building Permits/Housing Starts, Fed Gov. Bowman remarks, NZ PPI and GDT dairy results) could spark volatility — plan entries around confirmed price action signals and prioritize risk management.


    Disclaimer: The analysis provided for NZD/USD is for informational purposes only and does not constitute investment advice. Traders are encouraged to perform their own analysis and research before making any trading decisions on NZDUSD. Market conditions can change quickly, so staying informed with the latest data is essential.


    FXGlory
    08.19.2025

  3. #303
    Senior Member FXGlory Ltd's Avatar
    Join Date
    Mar 2024
    Posts
    314

    Visit FXGlory Ltd's Youtube Channel
    EURGBP H4 Technical and Fundamental Analysis for 08.20.2025


    Time Zone: GMT +3
    Time Frame: 4 Hours (H4)


    Fundamental Analysis:
    The EUR-GBP exchange rate remains highly reactive to inflation prints and central bank communication on both sides. Today’s focus is on the UK Consumer Price Index release from the Office for National Statistics and the scheduled speech by ECB President Christine Lagarde. A stronger-than-expected CPI reading would be bullish for the pound, potentially weighing on EURGBP, while any hawkish tone from Lagarde regarding Eurozone inflation and rates could support the euro and lift the cross. Historically, UK CPI tends to generate more immediate volatility than ECB speeches on the H4 timeframe, though sharp policy hints from Lagarde can create outsized swings. Traders analyzing EURGBP through fundamentals should watch these events closely, as they may shape near-term rate expectations and directional momentum.


    Price Action
    The EURGBP H4 chart shows signs of a completed bullish phase, with price failing to sustain the prior highs near 0.87200 and instead breaking lower into the 0.86200–0.86500 support zone. Recent candles reflect sideways consolidation with limited upside momentum, suggesting exhaustion of the earlier bullish trend. The immediate structure indicates that 0.86540 acts as key resistance, where repeated rejections highlight sellers defending the level. A sustained rejection here could reinforce downside continuation toward 0.86200, while only a decisive breakout above 0.86540 with follow-through would reopen the path toward 0.87200. Overall, this H4 price action favors cautious short setups below resistance, with stops placed above the recent rejection zone.


    Key Technical Indicators
    MACD (24,52,12): The MACD histogram is still in negative territory, though showing early signs of contraction as the bars turn less negative. This suggests bearish momentum is slowing but not yet reversed. A bullish crossover of the signal line would confirm momentum shifting, while continued weakness would reinforce downside bias.
    RSI (14): RSI currently sits near 50.5, reflecting neutral momentum after the prior down-leg. This midpoint reading signals indecision, with neither buyers nor sellers in control. A break above 60 would tilt bias bullish toward recovery, while a drop under 40 would favor continuation of the bearish structure.


    Support and Resistance
    Support: Immediate support is at 0.86230, aligning with the recent H4 swing low; secondary support lies near 0.85830, marking the lower correction zone.
    Resistance: The nearest resistance is 0.86540, defined by multiple recent rejections; the next level is 0.86760, coinciding with the upper H4 range.


    Conclusion and Consideration
    In summary, EURGBP on the H4 timeframe is currently caught between key fundamental catalysts and a technically vulnerable structure. With the pair consolidating below 0.86540 resistance and showing signs of bullish exhaustion, the bias leans slightly bearish unless buyers can force a decisive breakout above this level. The upcoming UK CPI release and ECB President Lagarde’s speech will likely provide the volatility needed for a clearer directional move. Until then, traders may favor cautious short positions below resistance while monitoring fundamental developments for potential momentum shifts. Overall, the balance of risks suggests a watchful stance, with downside continuation more probable unless strong Euro-driven catalysts emerge.


    Disclaimer: The analysis provided for EUR/GBP is for informational purposes only and does not constitute investment advice. Traders are encouraged to perform their own analysis and research before making any trading decisions on EURGBP. Market conditions can change quickly, so staying informed with the latest data is essential.


    FXGlory
    08.20.2025

  4. #304
    Senior Member FXGlory Ltd's Avatar
    Join Date
    Mar 2024
    Posts
    314

    Visit FXGlory Ltd's Youtube Channel
    GBPUSD Technical and Fundamental Analysis for 08.21.2025


    Time Zone: GMT +3
    Time Frame: 4 Hours (H4)


    Fundamental Analysis
    The GBPUSD currency pair is anticipating significant volatility due to today's scheduled economic events. For GBP, investors will closely monitor the public sector net borrowing data from the Office for National Statistics, which will indicate fiscal stability. Furthermore, the manufacturing and services PMI figures from S&P Global and the CBI Industrial Trends Survey are critical for assessing the UK's economic outlook. For the USD, traders will focus on Federal Reserve Bank of Atlanta President Raphael Bostic's speech and key economic indicators such as Initial Jobless Claims, Manufacturing and Services PMI, Philadelphia Fed Manufacturing Index, and Existing Home Sales. These events collectively could induce notable volatility in GBPUSD, guiding future monetary policy expectations.


    Price Action
    Analyzing GBPUSD in the H4 timeframe reveals a persistent bullish trend since 2022. Recently, the price successfully breached the resistance line of the most recent correction and is currently testing a significant support zone around 1.34568. The price action indicates potential bullish momentum towards the recent high at 1.37600. The proximity of RSI to oversold levels (near 30) further supports expectations for a reversal and continuation of the bullish trend.


    Key Technical Indicators
    RSI (14): Currently at 36.39, RSI is approaching oversold territory, suggesting that GBPUSD may soon experience a bullish reversal. Traders should be prepared for potential buying opportunities as the RSI crosses upward from the 30 level.
    MACD: The MACD is currently showing readings of -0.001429 and -0.000760. Although still negative, the narrowing gap between the MACD line and the signal line suggests weakening bearish momentum, setting the stage for a potential bullish crossover.
    Stochastic Oscillator: Stochastic values at 17.72 and 31.81 indicate the currency pair is significantly oversold. Such conditions typically precede a bullish reversal, highlighting favorable conditions for GBPUSD longs.


    Support and Resistance Levels
    Support: Immediate strong support is observed at the current price level of approximately 1.34568. Below this, the next critical support lies around the 1.34100 zone.
    Resistance: The nearest resistance levels are found at 1.35820, followed by the significant psychological barrier at 1.37600, representing the recent major high.


    Conclusion and Consideration
    The technical analysis of GBPUSD in the H4 timeframe indicates favorable conditions for a bullish reversal from the current support zone. Key technical indicators like RSI, MACD, and Stochastics reinforce the bullish outlook, especially as price nears oversold conditions. However, traders must remain cautious given the potential market volatility from today's key economic data releases affecting both GBP and USD. It's advisable to await confirmed bullish signals before committing to long positions.


    Disclaimer: The analysis provided for GBP/USD is for informational purposes only and does not constitute investment advice. Traders are encouraged to perform their own analysis and research before making any trading decisions on GBPUSD. Market conditions can change quickly, so staying informed with the latest data is essential.


    FXGlory
    08.21.2025

  5. #305
    Senior Member FXGlory Ltd's Avatar
    Join Date
    Mar 2024
    Posts
    314

    Visit FXGlory Ltd's Youtube Channel
    GOLDUSD H4 Technical and Fundamental Analysis for 08.22.2025


    Time Zone: GMT +3
    Time Frame: 4 Hours (H4)


    Fundamental Analysis:
    The gold market is currently influenced by ongoing USD strength expectations, driven by scheduled speeches from key Federal Reserve officials including Jerome Powell, Susan Collins, and Beth Hammack. Hawkish statements on monetary policy and economic outlook from these FOMC members could support USD appreciation, placing downward pressure on gold prices in the short term. Moreover, global inflation concerns and safe-haven demand for gold continue to influence the XAU/USD market, making it sensitive to both USD fluctuations and geopolitical risks. Traders should closely monitor these speeches for indications of interest rate changes that may impact gold’s price action on H4 and daily charts.


    Price Action:
    On the H4 chart, gold is showing a short-term bearish trend after testing the upper Bollinger Band and the 50% Fibonacci retracement level, which acted as strong resistance. The price has since moved toward the middle Bollinger Band and the 38.2% Fibonacci retracement level, indicating consolidation within the current range. The market is forming a symmetrical triangle pattern, with higher lows and lower highs, suggesting that a breakout from these trendlines could define the next directional move. Currently, gold is reacting to established support and resistance levels, and traders should observe whether the upper or lower trendline breaks.


    Key Technical Indicators:
    Bollinger Bands:
    Gold’s price recently reached the upper Bollinger Band and retraced toward the middle band, signaling short-term bearish momentum. The bands are moderately wide, indicating average volatility in the H4 timeframe. The price respecting both the upper and middle bands confirms the relevance of these levels in guiding intraday trades.
    MACD (Moving Average Convergence Divergence): The MACD line is at -0.673 and the signal line at -2.501, indicating bearish momentum in the short term. The histogram suggests a slight recovery but the overall trend remains negative, supporting a cautious approach for potential short trades.
    RSI (Relative Strength Index): The RSI is currently at 49.87, moving horizontally near the neutral zone. This indicates neither overbought nor oversold conditions, suggesting the market is consolidating and could respond sharply once a breakout from the triangle pattern occurs.


    Support and Resistance
    Support:
    Immediate support is near 3333.00, aligning with the 38.2% Fibonacci retracement level, with secondary support around 3330.00, marking a key area of prior consolidation.
    Resistance: The nearest resistance zone is between 3350.00 and 3355.00, coinciding with the 50% Fibonacci retracement level and the upper Bollinger Band, providing strong potential selling pressure.


    Conclusion and Consideration:
    Gold on the H4 chart is currently in a consolidation phase within a symmetrical triangle pattern. Short-term bearish momentum is observed, supported by the retracement from the upper Bollinger Band and MACD readings. Traders should watch key trendline breaks and upcoming USD-related news for directional confirmation. A break above 3355 could signal bullish momentum, while a drop below 3320 could accelerate the bearish trend. Market participants must remain cautious given the high volatility potential from upcoming speeches by Federal Reserve officials.


    Disclaimer: The analysis provided for GOLD/USD is for informational purposes only and does not constitute investment advice. Traders are encouraged to perform their own analysis and research before making any trading decisions on GOLDUSD. Market conditions can change quickly, so staying informed with the latest data is essential.


    FXGlory
    08.22.2025

  6. #306
    Senior Member FXGlory Ltd's Avatar
    Join Date
    Mar 2024
    Posts
    314

    Visit FXGlory Ltd's Youtube Channel
    USDCAD Daily Technical and Fundamental Analysis for 08.26.2025


    Time Zone: GMT +3
    Time Frame: 4 Hours (H4)


    Fundamental Analysis
    The USD-CAD pair reflects the exchange rate between the US Dollar (USD) and the Canadian Dollar (CAD). Today, significant volatility can be expected in USD-related pairs due to multiple key events. Federal Reserve Bank of New York President John Williams and Richmond President Thomas Barkin are scheduled to speak, potentially impacting monetary policy sentiment. Data on Durable Goods Orders excluding transportation items will be closely watched as they serve as leading indicators for manufacturing activity. Additionally, Bank of Canada Governor Tiff Macklem's speech on flexible inflation targeting at the Bank of Mexico Centennial Conference could induce CAD volatility. Traders should remain cautious and alert to sudden market moves.


    Price Action
    The USD/CAD pair has shown a clear bullish price action on the H4 timeframe. After maintaining an overall uptrend since mid-2021, the recent correction to Fibonacci retracement levels between 38.2% and 50% appears to have completed. Price has rebounded decisively, signaling a continuation of the bullish momentum. The market is currently aiming at the 23.6% Fibonacci retracement level, but the psychological resistance zone at 1.40000 remains a critical test ahead. Traders should closely monitor candlestick patterns around this key resistance for potential reversals or continuations.


    Key Technical Indicators
    RSI (28): Currently at 53.4, the RSI indicates balanced market conditions, with neither overbought nor oversold levels present. This mid-level position allows ample room for the price to move higher, supporting the potential continuation of the bullish trend in USD CAD.
    MACD (24,52,12): With values of 0.001697 and 0.002648, the MACD indicator shows bullish momentum, as the MACD line remains above the signal line. The positive histogram further confirms sustained bullish pressure. Traders should monitor the MACD closely for any divergence signs that might indicate a weakening trend.


    Support and Resistance
    Support: Immediate support stands at the 1.3750 Fibonacci level, aligned with recent swing lows and the previous correction bottom.
    Resistance: Key resistance is located at the psychological 1.4000 level, a major barrier that could potentially halt or slow down bullish momentum before price reaches the Fibonacci 23.6% retracement.


    Conclusion and Consideration
    The USD VS. CAD H4 chart analysis suggests a bullish outlook supported by current fundamental factors, recent price action, and technical indicators. Price action has returned to its broader uptrend after a healthy Fibonacci correction, with indicators pointing towards further bullish potential. However, traders must exercise caution due to today's high-impact speeches and durable goods data, potentially introducing market volatility.


    Disclaimer: The analysis provided for USD/CAD is for informational purposes only and does not constitute investment advice. Traders are encouraged to perform their own analysis and research before making any trading decisions on USDCAD. Market conditions can change quickly, so staying informed with the latest data is essential.


    FXGlory
    08.26.2025

  7. #307
    Senior Member FXGlory Ltd's Avatar
    Join Date
    Mar 2024
    Posts
    314

    Visit FXGlory Ltd's Youtube Channel
    GBPUSD H4 Technical and Fundamental Analysis for 08.27.2025


    Time Zone: GMT +3
    Time Frame: 4 Hours (H4)


    Fundamental Analysis:
    The GBP/USD pair today is influenced by key upcoming economic news on both the US Dollar (USD) and the British Pound (GBP). From the US side, traders will be closely monitoring the API and EIA crude oil inventory data, which usually impacts USD indirectly through energy-related price volatility, as well as a speech from Richmond Fed President Thomas Barkin that could provide further signals on Federal Reserve monetary policy. Hawkish commentary from FOMC members tends to support the USD, while dovish signals may weaken it. On the UK side, the Confederation of British Industry (CBI) Distributive Trades Survey will be released, reflecting consumer spending patterns. A stronger-than-expected CBI reading would support the GBP, while weaker results may exert downward pressure. Overall, mixed fundamentals suggest that GBP USD could remain volatile throughout today’s trading session.


    Price Action:
    On the H4 chart, GBP/USD price action shows that the pair is currently consolidating within a rectangle pattern, trapped between major support and resistance. The price has been respecting a long-term bullish trendline while at the same time struggling with a descending bearish trendline drawn from the mid-July highs. Since the beginning of August, the price has corrected upward from 1.3150 lows but is now facing resistance near the 1.3586 level. Currently, GBP/USD trades near the Bollinger Bands’ middle line, reflecting indecision and potential breakout conditions in either direction.


    Key Technical Indicators:
    Bollinger Bands: GBP/USD is moving around the middle Bollinger Band, with the last candles showing compression. This indicates reduced volatility and the possibility of an upcoming breakout. The upper band aligns closely with resistance near 1.3586, while the lower band supports the 1.3394 zone.
    Parabolic SAR: The last four Parabolic SAR dots are positioned above the candles, signaling bearish pressure. As long as SAR remains above price action, short-term sentiment may lean bearish, but a flip below candles would indicate renewed bullish momentum.
    RSI (Relative Strength Index): The RSI currently stands at 49.68, reflecting a neutral stance. This midpoint suggests that GBPUSD has not entered overbought or oversold territory, supporting the idea of consolidation before a potential breakout.
    MACD (Moving Average Convergence Divergence): The MACD line at -0.000103 and the signal line at -0.000002 show weak bearish momentum. The histogram remains flat, indicating a lack of strong directional bias. Traders should monitor for a potential crossover to confirm momentum shifts.


    Support and Resistance:
    Support: Strong support lies near 1.3394, followed by deeper support at 1.3153. These levels align with trendline confluence and recent swing lows.
    Resistance: The nearest resistance is at 1.3586, where the descending trendline and previous highs converge, acting as a strong barrier for buyers.


    Conclusion and Consideration:
    The GBP/USD H4 technical and fundamental analysis suggests that the pair is currently consolidating within a critical range, supported by a long-term bullish trendline but capped by a strong descending resistance line. Key technical indicators, including Bollinger Bands, RSI, MACD, and Parabolic SAR, point to indecision, with a potential breakout likely as volatility compresses. Traders should closely monitor today’s fundamental news from both the US and UK, as the combination of API/EIA crude data, FOMC commentary, and CBI survey results could trigger sharp moves.


    Disclaimer: The analysis provided for GBP/USD is for informational purposes only and does not constitute investment advice. Traders are encouraged to perform their own analysis and research before making any trading decisions on GBPUSD. Market conditions can change quickly, so staying informed with the latest data is essential.


    FXGlory
    08.27.2025

  8. #308
    Senior Member FXGlory Ltd's Avatar
    Join Date
    Mar 2024
    Posts
    314

    Visit FXGlory Ltd's Youtube Channel
    USDJPY Technical and Fundamental Analysis for 08.29.2025


    Time Zone: GMT +3
    Time Frame: 4 Hours (H4)


    Fundamental Analysis
    The USD-JPY pair is currently influenced by significant economic news from both the US and Japan. Today, traders will closely monitor the US Federal Reserve Governor Christopher Waller’s speech regarding monetary policy and inflation, potentially driving volatility for the USD. Additionally, US Personal Consumption Expenditures (PCE) data, income, and consumer spending reports are anticipated, each critically influencing USD valuation. On the JPY side, key indicators like Tokyo CPI, Jobless Rate, Industrial Production, Retail Trade, and Consumer Confidence are expected to shape trading sentiment and currency fluctuations significantly, possibly providing directional momentum to the pair.


    Price Action
    The USD/JPY pair on the H4 timeframe displays a transition from a previous downtrend, clearly broken by an upward momentum, evolving now into a sideways movement. Currently, the price is positioned at a critical horizontal support zone and an ascending support trendline, forming a hammer candlestick pattern signaling potential reversal. If bullish momentum confirms, the price may initially target the Bollinger Bands' midline around 147.48, with a potential continuation toward the upper band coinciding with the horizontal resistance zone.


    Key Technical Indicators
    Bollinger Bands:
    The Bollinger Bands have flattened significantly, indicating a consolidation phase with low volatility. The price is currently at the lower band, suggesting it could rebound toward the mid-band, implying potential bullish movement in the short term.
    RSI (28): The RSI currently stands at 45.25, showing neutral market sentiment. This moderate reading suggests the USDJPY has ample room to rise without immediate risk of becoming overbought, reinforcing the possibility of bullish momentum continuation.
    MACD (12,26,9): The MACD indicator shows a slightly negative histogram and a MACD line closely hugging the signal line, implying indecision and weak bearish momentum. Traders should watch for a bullish crossover as a signal to confirm a bullish scenario.


    Support and Resistance
    Support:
    Immediate support at 146.93, aligning with the horizontal support zone and ascending trendline. Further support observed at the psychological level of 146.39.
    Resistance: Key resistance levels are identified at 147.48 (mid Bollinger Band) and stronger resistance at 148.52 (horizontal resistance and upper Bollinger Band).


    Conclusion and Consideration
    In conclusion, the USD-JPY H4 technical and fundamental chart analysis indicates a potential bullish reversal scenario supported by price action, Bollinger Bands, and neutral RSI. However, MACD suggests caution until clearer bullish signals emerge. Traders must carefully monitor today's high-impact economic news from the US and Japan, which could introduce significant volatility and impact the USD Vs. JPY currency pair's directional bias.


    Disclaimer: The analysis provided for USD/JPY is for informational purposes only and does not constitute investment advice. Traders are encouraged to perform their own analysis and research before making any trading decisions on USDJPY. Market conditions can change quickly, so staying informed with the latest data is essential.


    FXGlory
    08.29.2025

  9. #309
    Senior Member FXGlory Ltd's Avatar
    Join Date
    Mar 2024
    Posts
    314

    Visit FXGlory Ltd's Youtube Channel
    EURGBP H4 Technical and Fundamental Analysis for 09.01.2025


    Time Zone: GMT +3
    Time Frame: 4 Hours (H4)


    Fundamental Analysis
    The EUR-GBP currency pair is influenced today by crucial economic indicators. For the Euro, traders await the S&P Global Manufacturing PMI release, which signals the health of the manufacturing industry across the Eurozone. An actual result exceeding forecasts typically strengthens the Euro by indicating economic expansion. Additionally, unemployment data from Eurostat will offer insights into labor-market conditions, affecting consumer spending. For GBP, significant data includes Nationwide Building Society’s House Price Index (HPI), reflecting housing sector health, and the S&P Global Manufacturing PMI. Traders should closely monitor these releases as stronger-than-expected figures generally bolster respective currencies.


    Price Action
    Analyzing EUR/GBP price action on the H4 chart shows an established uptrend. The pair recently touched the lower Bollinger Band and ascending trendline support, effectively bouncing upwards, reflecting continued bullish momentum. Price is now retreating from the upper Bollinger Band towards the middle line, suggesting a short-term correction. Given current dynamics, EURGBP may consolidate near the middle line before potentially resuming its upward trend.


    Key Technical Indicators
    Bollinger Bands: EURGBP's price has rebounded from the lower Bollinger Band, currently correcting after reaching the upper band. The narrowing bands imply potential consolidation, but sustained closeness to the upper half supports bullish continuation.
    RSI (28): The RSI stands at 54.37, indicating neutral momentum. There remains sufficient room for upward movement before approaching overbought territory, reinforcing potential bullish prospects after this correction.
    Stochastic Oscillator (5,3,3): The Stochastic indicator reads 56 and 65, demonstrating bullish crossover momentum. Although pointing downward temporarily, the indicator is within neutral territory, signaling potential bullish continuation following minor corrections.


    Support and Resistance
    Support: Immediate support is located at 0.8627, aligning with the recent ascending trendline and lower Bollinger Band.
    Resistance: The nearest resistance level is at 0.8689, coinciding with the recent swing high and the upper Bollinger Band.


    Conclusion and Consideration
    The EUR-GBP H4 analysis reveals an ongoing bullish bias, validated by supportive Bollinger Bands and neutral RSI and Stochastic indicators, which suggest potential bullish momentum continuation post-correction. Traders should pay close attention to today's economic releases from the Eurozone and the UK, as favorable data could reinforce bullish sentiment, potentially driving EURGBP higher. Key support and resistance levels identified will help manage risk and optimize trade entries and exits.


    Disclaimer: The analysis provided for EUR/GBP is for informational purposes only and does not constitute investment advice. Traders are encouraged to perform their own analysis and research before making any trading decisions on EURGBP. Market conditions can change quickly, so staying informed with the latest data is essential.


    FXGlory
    09.01.2025

  10. #310
    Senior Member FXGlory Ltd's Avatar
    Join Date
    Mar 2024
    Posts
    314

    Visit FXGlory Ltd's Youtube Channel
    EURJPY H4 Technical and Fundamental Analysis for 09.02.2025


    Time Zone: GMT +3
    Time Frame: 4 Hours (H4)


    Fundamental Analysis
    The EURJPY currency pair represents the valuation between the Euro (EUR) and the Japanese Yen (JPY). Today, Eurozone data highlights include the release of key inflation indicators (CPI and Core CPI) by Eurostat, potentially causing significant volatility in EUR pairs. Traders will closely monitor remarks from Deutsche Bundesbank President Joachim Nagel for insights on future ECB monetary policy directions. Concurrently, JPY traders await updates on the Bank of Japan's monetary base and the Japanese Government Bond auction, essential indicators that may impact the Yen significantly.


    Price Action
    The EURJPY H4 chart illustrates a clear bullish momentum, recently breaking above a horizontal consolidation channel. Despite the consistent bullish price action, traders should prepare for potential corrective moves towards Fibonacci retracement levels of 23.6%, 38.2%, or even 50.0%. Immediate bullish targets are set around the previous high at 172.826 or the subsequent resistance at 173.592. Traders are advised to confirm a sustained breakout for further bullish continuation.


    Key Technical Indicators
    MACD (Moving Average Convergence Divergence): The MACD indicator shows bullish momentum, with a signal line currently at 0.0996 and the histogram positively positioned at 0.2028. This indicates ongoing buyer dominance but suggests vigilance for signs of momentum exhaustion or reversal signals.
    RSI (Relative Strength Index): The RSI level is currently at 66.53, approaching the overbought threshold. Although bullish momentum persists, RSI readings near overbought conditions highlight the possibility of a short-term retracement or consolidation phase.


    Support and Resistance
    Support: Immediate support levels lie at Fibonacci retracement levels, notably at 172.130 (23.6%) and further down at 171.685 (38.2%).
    Resistance: Primary resistance targets include the recent high at 172.826 and the more significant resistance level at 173.592.


    Conclusion and Consideration
    The EURJPY pair maintains bullish momentum on the H4 timeframe, supported by favorable MACD and RSI indications. However, price actions near resistance zones and potential overbought signals suggest caution. Upcoming economic news from both the Eurozone and Japan could introduce substantial volatility, emphasizing the importance of risk management and close monitoring of key technical levels.


    Disclaimer: The analysis provided for EUR/JPY is for informational purposes only and does not constitute investment advice. Traders are encouraged to perform their own analysis and research before making any trading decisions on EURJPY. Market conditions can change quickly, so staying informed with the latest data is essential.


    FXGlory
    09.02.2025

Page 31 of 32 FirstFirst ... 21 29 30 31 32 LastLast

Bookmarks

Posting Permissions

  • You may not post new threads
  • You may not post replies
  • You may not post attachments
  • You may not edit your posts
  •