Page 29 of 31 FirstFirst ... 19 27 28 29 30 31 LastLast
Results 281 to 290 of 303
Like Tree4Likes

Daily Forex Analysis By FXGlory

This is a discussion on Daily Forex Analysis By FXGlory within the Analytics and News forums, part of the Trading Forum category; NZDUSD H4 Technical and Fundamental Analysis for 07.18.2025 Time Zone: GMT +3 Time Frame: 4 Hours (H4) Fundamental Analysis: Today's ...


  1. #281
    Senior Member FXGlory Ltd's Avatar
    Join Date
    Mar 2024
    Posts
    304

    Visit FXGlory Ltd's Youtube Channel
    NZDUSD H4 Technical and Fundamental Analysis for 07.18.2025


    Time Zone: GMT +3
    Time Frame: 4 Hours (H4)


    Fundamental Analysis:
    Today's NZD/USD fundamental analysis for the H4 timeframe reveals a focus on key economic data releases that could significantly impact the currency pair. For the USD, we are awaiting crucial reports including Treasury International Capital (TIC) data, Building Permits, Housing Starts, and the University of Michigan Consumer Sentiment and Inflation Expectations. Additionally, a speech from Federal Reserve Governor Christopher Waller will be closely watched for any hawkish or dovish signals on monetary policy, which can drive forex market volatility. The G20 meeting, while not a direct market mover today, highlights ongoing global economic discussions that could influence sentiment. For the NZD, the Reserve Bank of New Zealand (RBNZ) credit card spending data will provide insights into consumer activity and confidence. These economic indicators and speeches are vital for NZDUSD trading strategies and can lead to price action shifts.


    Price Action:
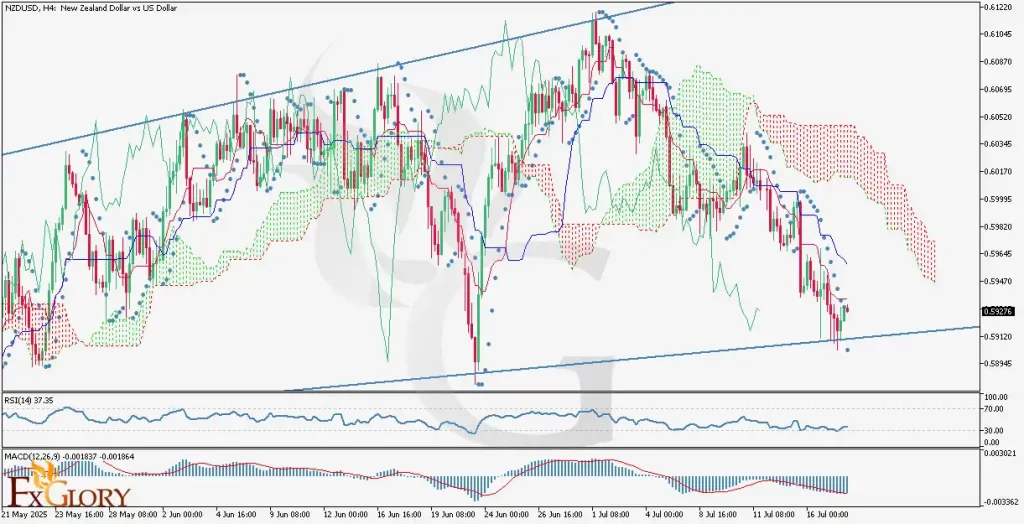
    The NZD/USD price action on the H4 chart indicates that the price is moving in a slight bullish trend in the long term but has reached a significant long-term trend line, which has consistently acted as a strong support level. This support trend line has been tested twice before, and each time the NZD USD price failed to break below it, leading to sharp bullish reversals. Currently, the short-term downward trend is showing signs of exhaustion, with the latest candles turning green, suggesting a potential correction or reversal. This pattern suggests that the support level might hold again, potentially leading to another bullish bounce, similar to previous instances where the price rebounded strongly after touching this critical level.


    Key Technical Indicators:
    Ichimoku Cloud:
    The NZD-USD price is currently moving below the Ichimoku Cloud, which is trending downwards and has thinned out. This indicates a prevailing bearish sentiment in the short-term forex trend, although the thinning cloud might suggest a weakening of this bearish momentum or a potential for future price breakout or reversal if the price manages to cross above it.
    Parabolic SAR (0.05 step, 0.2 maximum): The Parabolic SAR dots were initially placed above the candles, confirming the recent downtrend. However, the most recent dot has touched the last candle, and a new dot has now appeared below the candles. This Parabolic SAR signal is a strong indication of a potential NZD-USD trend reversal from bearish to bullish, suggesting upward momentum is building.
    RSI (Relative Strength Index): The RSI line has touched the 30 level, indicating that the NZD-USD pair was in oversold territory. Following this, the RSI has changed direction and is now moving upward, signaling a potential bullish divergence and a recovery in buying pressure. This RSI analysis supports the idea that the current downward move might be losing steam, paving the way for a bullish correction.
    MACD (Moving Average Convergence Divergence): The MACD (12,26,9) currently shows values of -0.001837 and -0.001864. While the indicator remains in bearish territory, the recent price action suggests decreasing downward momentum.


    Support and Resistance:
    Support:
    Immediate support for NZD/USD is identified at around 0.59050, coinciding with the long-term trend line that has historically acted as a strong floor.
    Resistance: The nearest resistance level for NZD/USD is located at around 0.60160, which represents a key psychological and technical barrier for further upside movement.


    Conclusion and Consideration:
    The NZD/USD H4 chart analysis indicates a critical juncture where the long-term bullish trend line is being tested after a short-term bearish correction. While the Ichimoku Cloud and Parabolic SAR initially suggested bearishness, the recent price action, particularly the bounce from the support line, the Parabolic SAR flip, and the upward turn of the RSI from oversold levels, strongly hint at an impending bullish correction or reversal. Traders should pay close attention to the upcoming USD and NZD economic news today, as these releases have the potential to introduce significant volatility and could either reinforce or invalidate the observed technical analysis signals. The combination of technical and fundamental factors suggests a cautious approach, with a readiness to capitalize on a potential bullish rebound from the 0.59050 support level, targeting the 0.60160 resistance.


    Disclaimer: The analysis provided for NZD/USD is for informational purposes only and does not constitute investment advice. Traders are encouraged to perform their own analysis and research before making any trading decisions on NZDUSD. Market conditions can change quickly, so staying informed with the latest data is essential.


    FXGlory
    07.18.2025

  2. #282
    Senior Member FXGlory Ltd's Avatar
    Join Date
    Mar 2024
    Posts
    304

    Visit FXGlory Ltd's Youtube Channel
    USDCAD Technical and Fundamental Analysis for 07.21.2025


    Time Zone: GMT +3
    Time Frame: 4 Hours (H4)


    Fundamental Analysis:
    Today, the US Dollar (USD) is influenced by The Conference Board’s Leading Indicators release, measuring economic direction through employment, housing, consumer confidence, and stock market trends. A higher-than-expected result could strengthen the USD. Meanwhile, the Canadian Dollar (CAD) anticipates volatility due to the release of Industrial Product Price Index (IPPI) and Raw Materials Price Index (RMPI) from Statistics Canada, significant indicators of inflation trends. Additionally, the Bank of Canada's (BOC) Senior Loan Officer Survey results could heavily impact CAD through insights on business conditions, investments, and inflation expectations.


    Price Action:
    Analyzing the USD/CAD H4 timeframe, after breaking short-term resistance (Resistance 1), the price advanced towards the significant 5-month resistance (Resistance 2), moving within a clear ascending channel. Recently, the price briefly broke above this resistance and then pulled back, retesting the channel's bottom line, confirming support. The ongoing bullish candles indicate a potential continuation upwards, supported by noticeable divergence between price and key oscillators, signaling the beginning of a bullish trend.


    Key Technical Indicators:
    Moving Average (21):
    The 21-period Moving Average acts as a dynamic support line. The USDCAD price is currently above this average, suggesting bullish momentum is maintained, offering traders confidence in long positions.
    RSI (Relative Strength Index): Currently at 53.06, RSI indicates neutral to mildly bullish conditions. There's sufficient room before reaching overbought territory, supporting the potential continuation of upward momentum.
    MACD (Moving Average Convergence Divergence): MACD shows a positive but decreasing histogram, with the MACD line narrowly above the signal line. Although bullish momentum persists, traders should be vigilant for a potential weakening in upward pressure.
    Stochastic Oscillator: At 57.39, the Stochastic indicator reflects moderate upward momentum, further reinforcing the current bullish stance. The crossover suggests continued bullish activity, supporting further price gains.


    Support and Resistance:
    Support: Immediate support is observed at the lower boundary of the ascending channel, around 1.3640. Stronger historical support appears at the previous Resistance 1 line.
    Resistance: The nearest critical resistance lies at the upper boundary of the ascending channel near 1.3780, with further robust resistance at the 5-month descending trendline (Resistance 2).


    Conclusion and Consideration:
    The USD-CAD pair exhibits bullish signals on the H4 chart, supported by Moving Average positioning, RSI neutrality, MACD positive crossover, and a rising Stochastic Oscillator. However, traders should remain cautious due to potential volatility from key fundamental economic releases from both the USD and CAD today. It's advisable to manage risks carefully and consider both technical and fundamental factors before entering trades.


    Disclaimer: The analysis provided for USD/CAD is for informational purposes only and does not constitute investment advice. Traders are encouraged to perform their own analysis and research before making any trading decisions on USDCAD. Market conditions can change quickly, so staying informed with the latest data is essential.


    FXGlory
    07.21.2025

  3. #283
    Senior Member FXGlory Ltd's Avatar
    Join Date
    Mar 2024
    Posts
    304

    Visit FXGlory Ltd's Youtube Channel
    GBPUSD H4 Technical and Fundamental Analysis for July 22, 2025


    Time Zone: GMT +3
    Time Frame: 4 Hours (H4)


    Fundamental Analysis:
    GBP/USD traders should brace for heightened volatility today, driven primarily by key economic events. The GBP is under scrutiny with the Office for National Statistics releasing data regarding the UK's public sector net borrowing. A lower-than-expected figure could strengthen GBP, indicating reduced budget deficits. Additionally, BOE Governor Andrew Bailey’s testimony on the Financial Stability Report will be closely monitored for hawkish signals on future monetary policy. On the USD side, Federal Reserve Chair Jerome Powell’s opening remarks at the Capital Framework Conference and the Richmond Fed Manufacturing Index could inject further volatility into the currency pair.


    Price Action:
    GBP-USD on the H4 chart maintains a long-term bullish trend despite a recent correction. The pair successfully found support within a critical support zone, validating buyers' strength through successive bullish candles. The recent price action has broken the corrective movement's resistance line, indicating a possible resumption of the bullish trajectory. If bullish momentum continues, the target zone marked clearly by historical price clusters could soon be reached.


    Key Technical Indicators:
    Parabolic SAR: The Parabolic SAR dots have flipped below the candlesticks, confirming a bullish reversal signal. This technical indicator strongly supports the continuation of the upward momentum in the GBPUSD H4 analysis.
    RSI (Relative Strength Index): Currently positioned at approximately 59.70, the RSI indicates a neutral-to-slightly bullish sentiment. It shows room for further upside movement without approaching overbought territory, supporting the potential bullish continuation.
    MACD (Moving Average Convergence Divergence): MACD indicates diminishing bearish momentum as the MACD line crosses above the signal line, reflecting renewed bullish momentum. Traders should watch for continued expansion of bullish histogram bars as a confirmation signal.


    Support and Resistance:
    Support: Immediate technical support is located around the recent low candle cluster near 1.3410-1.3385. A break below this zone could trigger a bearish correction.
    Resistance: Immediate resistance is observed at the recent highs around the 1.3580-1.3625 area, coinciding with historical price reaction points.


    Conclusion and Consideration:
    GBP USD is positioned to resume its bullish trend on the H4 timeframe, backed by recent price action and supported by key technical indicators such as Parabolic SAR, RSI, and MACD. Today's fundamental events involving key speeches from BOE's Andrew Bailey and Fed Chair Jerome Powell may lead to increased volatility and rapid price movements. Traders should exercise caution and consider fundamental news impacts in their trading strategies, managing positions and risk accordingly.


    Disclaimer: The analysis provided for GBP/USD is for informational purposes only and does not constitute investment advice. Traders are encouraged to perform their own analysis and research before making any trading decisions on GBPUSD. Market conditions can change quickly, so staying informed with the latest data is essential.


    FXGlory
    07.22.2025

  4. #284
    Senior Member FXGlory Ltd's Avatar
    Join Date
    Mar 2024
    Posts
    304

    Visit FXGlory Ltd's Youtube Channel
    Gold H4 Technical and Fundamental Analysis for 07.23.2025


    Time Zone: GMT +3
    Time Frame: 4 Hours (H4)


    Fundamental Analysis:
    Gold (XAU/USD) traders should brace for volatility due to key economic indicators. The American Petroleum Institute (API) will release its weekly crude oil inventory report, with a smaller-than-expected drop in stockpiles possibly supporting gold prices by signaling a tightening supply. Additionally, the National Association of Realtors will publish monthly home sales data, where stronger-than-forecast results could boost sentiment and drive demand for gold as a safe haven. Traders will also watch the Energy Information Administration (EIA) report on crude inventories for signs of supply-demand imbalances, which could further influence gold prices.


    Price Action:
    XAU/USD on the H4 chart is currently testing a significant resistance area, which has held price back in the past. The recent price action shows strong bullish momentum, and the pair is approaching this key resistance level with increasing buying pressure. If this resistance is broken, further upward movement is likely, as the market appears to be gaining strength. The RSI indicator is already in the overbought region, suggesting that momentum is on the side of buyers. If the resistance zone is successfully breached, the next target could be higher, driven by the continued bullish trend.


    Key Technical Indicators:
    RSI (Relative Strength Index): The RSI is currently at 76.83, in the overbought zone, signaling strong bullish momentum. Though approaching higher levels, it still has room for further upside before reaching extreme conditions, suggesting continued growth potential if resistance is broken.
    MACD (Moving Average Convergence Divergence): The MACD shows strong bullish momentum, with the MACD line above the signal line and the histogram expanding. This indicates solid buying pressure, suggesting that further bullish movement is likely if the momentum continues.


    Support and Resistance:
    Support: Immediate technical support is found around the recent low levels near 3,173.12-3,176.25. A break below this zone could signal a potential retracement or correction in the price.
    Resistance: Immediate resistance is observed at the recent high levels around 3,435.04-3,451.17, which aligns with significant price reaction points. A break above this resistance could lead to further bullish movement.


    Conclusion and Consideration:
    In conclusion, the analysis for XAU/USD (Gold) on the H4 chart suggests a bullish outlook, with further upside potential if key resistance levels are broken. Strong price action and momentum from the RSI and MACD support continued gains. However, traders should be mindful of volatility from key economic reports like the API crude oil inventory and EIA supply-demand updates. Immediate support is at 3,173.12-3,176.25, with resistance at 3,435.04-3,451.17. A break above resistance may fuel more bullish movement, while a decline below support could signal a retracement. Monitoring these levels is crucial for determining the next moves in gold.


    Disclaimer: The analysis provided for XAU/USD is for informational purposes only and does not constitute investment advice. Traders are encouraged to perform their own analysis and research before making any trading decisions on XAUUSD. Market conditions can change quickly, so staying informed with the latest data is essential.


    FXGlory
    07.23.2025

  5. #285
    Senior Member FXGlory Ltd's Avatar
    Join Date
    Mar 2024
    Posts
    304

    Visit FXGlory Ltd's Youtube Channel
    EURUSD H4 Daily Technical and Fundamental Analysis for 07.24.2025


    Time Zone: GMT +3
    Time Frame: 4 Hours (H4)


    Fundamental Analysis:
    The EUR/USD currency pair today faces key economic indicators from both the Eurozone and the United States, potentially driving volatility. The upcoming releases include consumer sentiment from NIQ, unemployment rates, and several critical PMI readings from S&P Global, expected to significantly impact the EUR’s strength. Similarly, the USD may experience volatility with upcoming PMI data from manufacturing and services sectors and new home sales data. Traders should closely monitor these releases as they provide insight into economic health and consumer confidence, influencing the short-term direction of EUR-USD.


    Price Action:
    The EUR vs. USD H4 analysis indicates a robust bullish price action. After a prolonged corrective move, price reacted positively to the long-term ascending trendline support, recently breaking above the correction’s resistance line. The clear bullish candle breakout suggests strong bullish momentum. Moreover, given the RSI divergence confirming the bullish strength, the previous swing high before the correction emerges as a probable price target.


    Key Technical Indicators:
    Parabolic SAR: The Parabolic SAR indicator has shifted below the current price action, confirming bullish momentum. Dots positioned beneath candlesticks indicate a clear upward trend continuation signal for EURUSD on the H4 timeframe.
    RSI (Relative Strength Index): RSI stands at approximately 69.36, nearing overbought conditions but notably displaying a bullish divergence against recent price lows. This divergence underlines solid bullish momentum, suggesting potential further gains before significant corrections.
    Stochastic Oscillator: The Stochastic Oscillator, currently around 89.99, indicates strongly overbought conditions. Despite this, it continues to reflect bullish strength. Traders should remain vigilant for possible short-term retracements due to overextended price conditions.


    Support and Resistance:
    Support: Immediate support is located at the recent breakout point near 1.1665, aligning with the ascending trendline support.
    Resistance: Initial resistance is observed at the recent swing high around 1.1795; overcoming this level could open the pathway toward higher resistance at approximately 1.1845.


    Conclusion and Consideration:
    The EUR/USD H4 timeframe technical analysis favors bullish continuation, supported by decisive price action and confirming indicators like RSI divergence and Parabolic SAR signals. Despite strong bullish sentiment, traders should exercise caution considering the overbought signals from the Stochastic oscillator. Upcoming economic releases for EUR and USD warrant careful attention due to their potential to create substantial volatility and directional changes.


    Disclaimer: The analysis provided for EUR/USD is for informational purposes only and does not constitute investment advice. Traders are encouraged to perform their own analysis and research before making any trading decisions on EURUSD. Market conditions can change quickly, so staying informed with the latest data is essential.


    FXGlory
    07.24.2025

  6. #286
    Senior Member FXGlory Ltd's Avatar
    Join Date
    Mar 2024
    Posts
    304

    Visit FXGlory Ltd's Youtube Channel
    BTCUSD H4 Technical and Fundamental Analysis for 07.25.2025


    Time Zone: GMT +3
    Time Frame: 4 Hours (H4)


    Fundamental Analysis:
    BTC-USD price dynamics today could be influenced significantly by the USD economic data release from the Census Bureau regarding Durable Goods Orders and Core Durable Goods Orders (excluding transportation). Historically, stronger-than-expected data is supportive of the US Dollar, potentially applying downward pressure on BTCUSD prices. Traders should closely monitor today's release, as robust economic data could trigger volatility, influencing both USD strength and risk appetite among cryptocurrency investors.


    Price Action:
    BTC USD analysis on the H4 chart shows the formation of a classic descending triangle following the recent All-Time High (ATH) around $123,000. This typically bearish formation signals potential downside risk and a possible correction toward the previous breakout level around $111,700. Currently, BTC vs. USD price action is testing a critical uptrend support line, presenting a pivotal decision point. Traders must monitor which trendline breaks first, as a decisive move could set the tone for the near-term BTCUSD direction.


    Key Technical Indicators:
    Parabolic SAR: The Parabolic SAR indicator is currently plotting dots above the recent candles, indicating a bearish sentiment in BTCUSD’s short-term price action. Traders may interpret this as a potential indication for continuation of the corrective move.
    RSI (Relative Strength Index): RSI is currently around 52, situated near the midpoint, indicating neutral momentum in BTCUSD price. This positioning suggests that the market is undecided, making a breakout above or below current trendlines more impactful.
    MACD (Moving Average Convergence Divergence): The MACD histogram and signal line are hovering around the zero level, signaling a neutral momentum for BTC-USD. This equilibrium indicates that market participants are awaiting stronger directional cues before committing.


    Support and Resistance:
    Support: The immediate and critical support lies at the ascending trendline around $118,200. A break below this could accelerate the move toward the major support at the previously broken resistance level near $111,700.
    Resistance: Key resistance is located at the recent ATH around $123,000. A bullish breakout above this resistance could signal renewed upward momentum and target fresh highs.


    Conclusion and Consideration:
    BTC USD is at a critical juncture on the H4 chart, with significant uncertainty as indicated by neutral technical indicators like RSI and MACD. The bearish formation of the descending triangle is balanced by strong ascending trendline support. Today's USD economic data, particularly Durable Goods Orders, may serve as a catalyst for volatility, and traders should carefully manage risk accordingly. It is prudent to wait for a confirmed breakout in either direction before initiating new positions.


    Disclaimer: The analysis provided for BTC/USD is for informational purposes only and does not constitute investment advice. Traders are encouraged to perform their own analysis and research before making any trading decisions on BTCUSD. Market conditions can change quickly, so staying informed with the latest data is essential.


    FXGlory
    07.25.2025

  7. #287
    Senior Member FXGlory Ltd's Avatar
    Join Date
    Mar 2024
    Posts
    304

    Visit FXGlory Ltd's Youtube Channel
    ETHUSD H4 Technical and Fundamental Analysis for 07.28.2025


    Time Zone: GMT +3
    Time Frame: 4 Hours (H4)


    Fundamental Analysis:
    Today, ETH/USD market participants should closely monitor two major economic events influencing volatility. The US and EU have finalized a trade deal, imposing a 15% US tariff on most EU exports, including critical sectors like automobiles, pharmaceuticals, and semiconductors. While lower than the initially proposed 30%, the continued 50% tariff on steel and aluminum may induce market caution. Additionally, significant attention is on the upcoming US-China tariff negotiations in Stockholm. A positive outcome from these talks could ease investor tensions and boost risk assets such as Ethereum, supporting further bullish sentiment for ETH-USD.


    Price Action:
    Technical analysis of ETH USD on the H4 timeframe shows a bullish momentum reasserting itself. After failing to break the crucial resistance level of 3825 initially, ETH/USD underwent an 8% price correction, finding strong buying pressure at the ascending support line. Currently, ETH-USD is again challenging the 3825 level with renewed strength, indicating strong bullish intent. Should the price decisively close above this key resistance, a further move toward the 4100 area is expected.


    Key Technical Indicators:
    Parabolic SAR: ETHUSD’s Parabolic SAR dots have shifted below the candlesticks, signaling a fresh bullish phase and suggesting that upward momentum will likely persist in the short term.
    RSI (Relative Strength Index): The RSI currently hovers around the 64.47 level. There is clear bullish divergence signaling sustained buying interest and room for ETHUSD to extend gains without immediate risk of overbought conditions.
    MACD (Moving Average Convergence Divergence): The MACD indicator registers positive values at approximately 39.378 and 35.965, with the MACD line above the signal line. This alignment underscores increasing bullish momentum, reinforcing the likelihood of price continuation upward.
    Stochastic Oscillator: ETH-USD’s stochastic oscillator currently stands at approximately 70.30 and 60.14. This indicator further supports bullish momentum, although traders should remain vigilant for potential short-term pullbacks, particularly near resistance.


    Support and Resistance:
    Support: Immediate key support lies at 3600, reinforced by the ascending trendline.
    Resistance: Critical immediate resistance is positioned at 3825, with further resistance projected around the psychological level of 4100.


    Conclusion and Consideration:
    ETHUSD’s H4 technical chart analysis strongly favors continued bullish price action, supported by bullish signals across the Parabolic SAR, RSI, MACD, and stochastic indicators. With supportive fundamental developments anticipated from US-China tariff negotiations and stabilized US-EU trade relations, ETH vs. USD has favorable conditions for breaking higher. However, traders must remain cautious near key resistance levels and closely watch upcoming economic news developments that may significantly influence market volatility.


    Disclaimer: The analysis provided for ETH/USD is for informational purposes only and does not constitute investment advice. Traders are encouraged to perform their own analysis and research before making any trading decisions on ETHUSD. Market conditions can change quickly, so staying informed with the latest data is essential.


    FXGlory
    07.28.2025

  8. #288
    Senior Member FXGlory Ltd's Avatar
    Join Date
    Mar 2024
    Posts
    304

    Visit FXGlory Ltd's Youtube Channel
    GBPUSD Daily Technical and Fundamental Analysis for 07.29.2025


    Time Zone: GMT +3
    Time Frame: 4 Hours (H4)


    Fundamental Analysis:
    Today, GBP-USD market sentiment is influenced by significant economic indicators from both the UK and US economies. The British Retail Consortium (BRC) Price Index data release today could lead to increased volatility in GBP pairs, especially ahead of tomorrow's Bank of England monetary policy announcement. A stronger-than-forecast reading would positively impact GBP, as traders look for early signs of inflationary pressures. Conversely, the US Dollar will be impacted by the Census Bureau’s Trade Balance data and Wholesale Inventories figures, potentially influencing short-term USD demand. Market participants should closely monitor these releases for cues on the GBPUSD exchange rate movements.


    Price Action:
    The GBP/USD H4 chart indicates the price has entered a Potential Reversal Zone (PRZ), identified between the broken support-turned-resistance around 1.33790 and the next significant support around 1.33020 derived from the latest cluster zone of candles. Price action traders are observing closely for signs of bullish reversal as the PRZ could act as a robust pivot area, potentially pushing prices upward towards the EMA21. However, if the PRZ fails to hold, a further bearish movement toward 1.33020 support is probable.


    Key Technical Indicators:
    EMA21: The GBPUSD pair price is currently below the EMA21 line, confirming a bearish short-term outlook. Traders might await a potential upward retest of the EMA21 for further bearish confirmation or reversal signals.
    RSI (Relative Strength Index): The RSI stands at 27.66, signaling the market is in oversold conditions. This suggests a potential price reversal could occur soon, particularly given the RSI divergence observed in the H1 timeframe, enhancing the likelihood of a bullish correction.
    MACD (Moving Average Convergence Divergence): The MACD indicator currently shows values of -0.0032 for the MACD line and -0.001818 for the signal line, indicating strong bearish momentum. Traders should monitor closely for potential bullish crossover signals in the coming sessions, signifying weakening bearish pressure.


    Support and Resistance:
    Support: Immediate and critical support is located at approximately 1.33020, corresponding with recent cluster lows.
    Resistance: The nearest resistance level is now situated at around 1.33790, previously acting as significant support but currently broken and potentially acting as a resistance.


    Conclusion and Consideration:
    In conclusion, the GBP-USD pair on the H4 chart is currently in a critical reversal zone, supported by oversold RSI conditions, suggesting potential bullish reversal opportunities. The bearish momentum confirmed by EMA21 and MACD highlights caution for bullish entries. Traders should monitor today's economic data closely, as market reactions could sharply influence GBP/USD volatility. Appropriate risk management strategies are highly recommended due to upcoming data-driven market uncertainties.


    Disclaimer: The analysis provided for GBP/USD is for informational purposes only and does not constitute investment advice. Traders are encouraged to perform their own analysis and research before making any trading decisions on GBPUSD. Market conditions can change quickly, so staying informed with the latest data is essential.


    FXGlory
    07.29.2025

  9. #289
    Senior Member FXGlory Ltd's Avatar
    Join Date
    Mar 2024
    Posts
    304

    Visit FXGlory Ltd's Youtube Channel
    EURUSD H4 Technical and Fundamental Analysis for 07.30.2025


    Time Zone: GMT +3
    Time Frame: 4 Hours (H4)


    Fundamental Analysis:
    Today’s EUR/USD analysis is framed by multiple Eurozone macroeconomic indicators due for release. With data on consumer spending, GDP, and retail sales scheduled, traders are closely watching for signs of economic resilience. A stronger-than-forecast reading would typically be bullish for the euro, especially from the INSEE and Destatis GDP reports. Meanwhile, the USD awaits impactful data later in the week, including ADP employment data and crude oil inventories, which may shift the Fed’s interest rate expectations. For now, mixed macro signals leave EUR/USD highly sensitive to incoming figures and central bank sentiment, particularly in light of persistent inflationary concerns across the Eurozone and potential Fed policy adjustments.


    Price Action:
    The EUR/USD pair on the H4 timeframe has initiated a sharp bearish correction from the 1.17300 peak, losing approximately -2.14% since the start of the week. After a strong downward move, price action found temporary support near the 23.6% Fibonacci retracement level at 1.15300. This has led to two green candles forming, suggesting a short-term rebound. However, the current downtrend structure remains dominant, with lower highs and lower lows evident. If the price fails to break through the resistance at the 38.2% (1.15820) or 50.0% (1.16250) retracement levels, a renewed decline could target the 0.0% Fibonacci level around 1.14500.


    Key Technical Indicators:
    Moving Averages: The 9-period EMA (blue) has decisively crossed below the 17-period EMA (orange), confirming the bearish shift in momentum on the EUR-USD H4 chart. This crossover early in the week has continued to guide price lower, acting as dynamic resistance during minor pullbacks.
    Parabolic SAR: The Parabolic SAR dots are firmly positioned above the recent H4 candles, affirming bearish momentum. The indicator has been consistent in signaling downward price action and will remain a key reference point until a reversal signal forms below price.
    MACD (Moving Average Convergence Divergence): The MACD histogram is strongly negative, with the MACD line at -0.004621 and the signal line at -0.002724. This widening gap suggests persistent downside pressure. However, traders should monitor for potential MACD convergence if upward corrective movement continues in the next few candles.


    Support and Resistance:
    Support: The key short-term support lies around the 1.15300 zone, coinciding with the 23.6% Fibonacci level. A break below this level could accelerate the move toward the 0.0% retracement near 1.14500.
    Resistance: Immediate resistance stands at 1.15820 (38.2% Fib level). A further upside correction could face resistance at 1.16250 (50.0% Fib), with the stronger bearish barrier remaining around the 1.16700 region.


    Conclusion and Consideration:
    The EUR/USD H4 chart technical analysis signals a prevailing bearish bias, reinforced by the moving averages crossover, downward MACD momentum, and Parabolic SAR positioning. Although the pair shows a temporary bounce from 1.15300 support, any upward retracement toward the 38.2% or 50.0% Fibonacci levels may encounter renewed selling pressure. From a fundamental standpoint, key EUR economic data today may introduce volatility, but until significant bullish catalysts emerge, bears remain in control. Caution is advised for long positions unless confirmed by reversal signals.


    Disclaimer: The analysis provided for EUR/USD is for informational purposes only and does not constitute investment advice. Traders are encouraged to perform their own analysis and research before making any trading decisions on EURUSD. Market conditions can change quickly, so staying informed with the latest data is essential.


    FXGlory
    07.30.2025

  10. #290
    Senior Member FXGlory Ltd's Avatar
    Join Date
    Mar 2024
    Posts
    304

    Visit FXGlory Ltd's Youtube Channel
    USDJPY Daily Technical and Fundamental Analysis for 07.31.2025


    Time Zone: GMT +3
    Time Frame: 4 Hours (H4)


    Fundamental Analysis:
    The USD-JPY currency pair is likely to experience increased volatility today due to significant economic releases from both Japan and the United States. Japanese Industrial Production, Retail Sales, and Consumer Confidence data are scheduled, which will provide crucial insights into the economic health of Japan. Additionally, market participants will closely monitor the outcomes of the Bank of Japan's monetary policy statements and comments by the BOJ Governor for indications of future policy shifts. From the U.S. side, traders will pay close attention to the Core PCE Price Index and Unemployment Claims, which can significantly influence the USD valuation, as these metrics directly affect the Federal Reserve's monetary policy outlook.


    Price Action:
    The USD/JPY pair has transitioned into a bullish phase on the H4 chart, clearly evident after breaking the resistance line of its previous downtrend. Currently, the pair is trading within an ascending channel, consistently respecting its boundaries. After recently bouncing off the channel’s lower trendline, the price appears headed toward the upper boundary, setting a potential bullish target. The recent bullish candles reinforce the upward momentum, suggesting continued bullish sentiment in the short term.


    Key Technical Indicators:
    Parabolic SAR: The Parabolic SAR indicators have consistently formed below the last four candles, indicating a clear bullish momentum in the short-term price action of the USD JPY pair. Traders can interpret this as a potential continuation signal toward the upper channel boundary.
    RSI (Relative Strength Index): Currently, the RSI stands at 65.69, signaling robust bullish strength but still beneath the overbought threshold of 70. This indicates that while bullish momentum is strong, there is still room for further upside before becoming overextended.
    MACD (Moving Average Convergence Divergence): The MACD indicator presents values of 0.4017 and 0.3214, with the MACD line positioned above the signal line, supporting the bullish scenario. This positioning suggests continued buying momentum, albeit with caution for potential weakening if the MACD line converges toward the signal line in upcoming sessions.


    Support and Resistance:
    Support: Immediate support for the USD-JPY pair is found at approximately 147.435, aligning with the lower boundary of the ascending channel and recent swing lows.
    Resistance: Key resistance is expected near the upper boundary of the ascending channel around 149.640, coinciding with recent peaks that could challenge bullish momentum.


    Conclusion and Consideration:
    The USD-JPY H4 chart currently favors bullish continuation, supported by key technical indicators such as Parabolic SAR, RSI, and MACD, along with constructive price action within the ascending channel. However, market participants should remain cautious given today’s significant economic data and monetary policy announcements from both Japan and the United States, potentially increasing volatility. Monitoring key resistance and support levels will be essential to effectively manage trading positions.


    Disclaimer: The analysis provided for USD/JPY is for informational purposes only and does not constitute investment advice. Traders are encouraged to perform their own analysis and research before making any trading decisions on USDJPY. Market conditions can change quickly, so staying informed with the latest data is essential.


    FXGlory
    07.31.2025

Page 29 of 31 FirstFirst ... 19 27 28 29 30 31 LastLast

Bookmarks

Posting Permissions

  • You may not post new threads
  • You may not post replies
  • You may not post attachments
  • You may not edit your posts
  •