
 1Likes
 LinkBack URL
 About LinkBacks


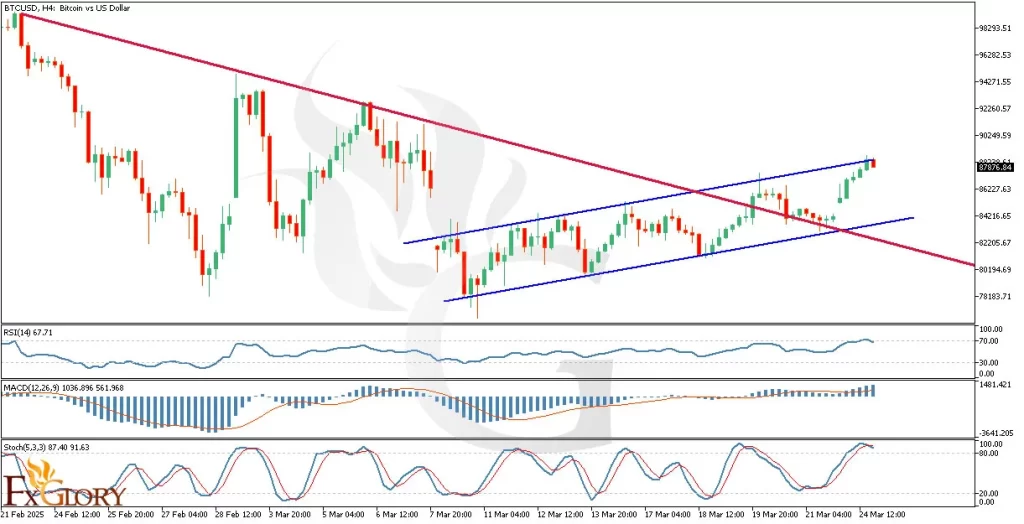
BTCUSD Daily Technical and Fundamental Analysis for 03.25.2025
Time Zone: GMT +2
Time Frame: 4 Hours (H4)
Fundamental Analysis:
The BTC-USD pair is primarily driven by ongoing developments in regulatory landscapes and macroeconomic conditions. Today, traders will closely monitor remarks by Federal Reserve Governor Adriana Kugler and New York Fed President John Williams. Hawkish statements could strengthen the USD, potentially impacting BTCUSD negatively. Additionally, data on the US housing market, including the S&P Corelogic CS Indices and the House Price Index (HPI), may cause volatility, reflecting investor sentiment towards the USD and subsequently influencing Bitcoin's price action.
Price Action:
The BTC/USD H4 chart indicates a significant bullish breakout from its previous downtrend, marked clearly by crossing above the downward trendline (red). Currently, the price action has encountered resistance at the upper boundary of an ascending channel, highlighting a potential retracement scenario. The most recent candle, a bearish signal, further supports the probability of a short-term corrective move towards the lower boundary of the ascending channel before resuming the upward momentum.
Key Technical Indicators:
RSI (Relative Strength Index): The RSI currently stands at 67.71, nearing the overbought territory of 70. This signals that BTCUSD may experience limited upside potential in the short term, reinforcing expectations of a temporary pullback or consolidation period.
MACD (Moving Average Convergence Divergence): The MACD histogram remains positive, though bars are slightly shortening, indicating a potential weakening in bullish momentum. Traders should observe the MACD line closely for signs of a bearish crossover, which would confirm a shift towards downward pressure.
Stochastic Oscillator: Currently reading at 87.40, the Stochastic indicator clearly signals an overbought condition. This technical evidence strongly supports the likelihood of a forthcoming corrective move or a temporary bearish reversal before bulls regain control.
Support and Resistance:
Support: Immediate support lies near $84,200, the lower boundary of the ascending channel, followed by a stronger support around the previous resistance-turned-support at $82,260.
Resistance: Initial resistance is currently observed at $87,870, coinciding with the top boundary of the ascending channel. Breaking above this could target the psychological resistance at $90,000.
Conclusion and Consideration:
BTC-USD on the H4 timeframe remains overall bullish following a breakout from a prior downtrend. However, the current technical indicators strongly suggest a potential short-term correction due to overbought conditions. Traders should exercise caution and closely monitor upcoming fundamental events from the US economic calendar, which might significantly impact short-term volatility. Proper risk management is recommended during these potentially turbulent trading conditions.
Disclaimer: The analysis provided for BTC/USD is for informational purposes only and does not constitute investment advice. Traders are encouraged to perform their own analysis and research before making any trading decisions on BTCUSD. Market conditions can change quickly, so staying informed with the latest data is essential.
FXGlory
03.25.2025


 Reply With Quote


Bookmarks