Page 1 of 43 1 2 3 11 ... LastLast
Results 1 to 10 of 430

Re: SuperForex - Company News

This is a discussion on Re: SuperForex - Company News within the Forex Brokers forums, part of the Trading Forum category; GBP/AUD & the Expected Explosion We have a rule on the Forex market that says that after any isolation comes ...


  1. #1
    Senior Member SuperForex's Avatar
    Join Date
    Dec 2016
    Posts
    423

    Re: SuperForex - Company News

    GBP/AUD & the Expected Explosion

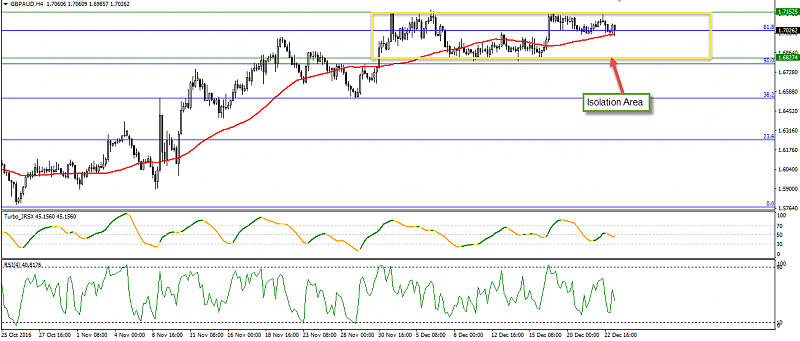
    We have a rule on the Forex market that says that after any isolation comes an explosion in prices - either up or down - and many traders always search for isolation areas and wait for the price to break this area to enter the market.
    The GBP/AUD currency pair has been trading within a tight trading area between 1.6827 and 1.7152 for a month. We saw the current account from the UK which came this morning in positive figures at -25.5B compared with the previous one at -28.7B and most of the news released in the past few days came in positive. This means the GBP currency is still steady against the AUD at 1.7026 at this moment and we see the pair touching the SMA 50 which represents a support area for the pair.
    If we drew the Fibonacci retracement from 1.7796 to 1.7560 we will see the pair is trading around 61.8% which is telling us the pair will decline in the next few days but we have the wait for the breaking down the referred area on the chart below.
    The turbo trend indicator in the middle window gave us a brown color signal, so we can expect the pair to start a down wave, and the RSI indicator confirmed that.
    The Next Few Days

    From this analysis we can give you our expectations about the pair's movement: it may decline to 1.6850 after breaking the SMA and if it breaks the 1.6820 it might decline to 1.6580 as a first target.

    Re: SuperForex - Company News-otdodc6o4yn8uxbkygor9l18q.png

  2. #2
    Senior Member SuperForex's Avatar
    Join Date
    Dec 2016
    Posts
    423
    GOLD (XAU/USD): Review & Monthly Forecast

    Last month the downward trend on the Gold's chart intensified strongly. The strengthening of the dollar has brought down the price for Gold. The strong dollar became the most attractive tool for investors, which is why demand for metals didn't increase significantly. The rates have decreased until the levels from January 2016. At the moment, the value of the Gold is $1130 - $200 less than what it was just two-three months ago.

    Now the drop in the value of Gold has stopped for a week and has kept this level. The incresing demand in Russia, India and China has a positive impact of Gold prices. When the price of the yellow metal is at a low level countries tend to buy it in larger quantities, but this has led to a strong consolidation of prices at the current level. Anyway, it’s not worth it expecting further rapid decreases in the prices as before.

    On the chart we can see that the quotes are in the downtrend which was formed in September, but we can note that the resistance line is strongly shifted to the bottom. Probably in the next few months a flat trend can form, but it is too early to speak about the formation of a new trend. The gold will continue to be under the pressure of the strong U.S dollar, which will remain more attractive for investors in the near future. The price can decrease again. Oscillators appear neutral. Given that there are no prerequisites for the growth of gold prices, the most optimal move is to open short positions on the trend in medium-term trading.


  3. #3
    Senior Member SuperForex's Avatar
    Join Date
    Dec 2016
    Posts
    423
    Technical analysis of the currency pair USD / CHF on 27/12/2016. The daily chart

    General analysis
    Over the past seven trading days, the pair USD / CHF is moving sideways after the formation of peak at 1.0340. The price has been approached to resistance level 1.0340 for a third time but was never able to overcome it. Last time the price was in the area of the mark 1.0340 in November 2015 after which began a long sideways movement where we are today.

    The prospect of breaking through the 1.0340 resistance for the pair USD / CHF is large enough.
    We can see it on the fundamental data from America and Europe and by the help of technical analysis on the graph as well.

    Most likely we will see two scenarios of further developments for USD / CHF:

    Scenario #1
    : Break of 1.0340 resistance and exit from the sideways movement.
    In this scenario, the transaction to buy should be opened after the formation of the confirmation of the breakout with a few candles up.
    The objectives of the profit will be levels 1.0430 and 1.0450.

    Scenario #2: Rebound from 1.0340 and resistance and reduced within the side channel.
    Now the price has suspended its growth near resistance 1.0340 and began to form a correctional movement.
    In case of breaking the support level of 1.0180 the price is likely to continue to decline within channel and when this scenario, the sales will be relevant below the 1.0180 with target points of profit taking at 1.0085 and 09950.


  4. #4
    Senior Member SuperForex's Avatar
    Join Date
    Dec 2016
    Posts
    423
    Crude oil (CL/WTI): review and forecast for the near month

    Oil prices for the last few months were under the influence of the USD rates and events related with OPEC and making of the Agreement on reduction of the crude oil extraction. Implementation of Agreement should begin since January 2017, so the market is awaiting whether the Agreement will be executed by all countries-exporters. Investors remain optimistic for a while and the prices continues increasing. In particular, yesterday the price of oil reached a 17- month high.
    In the near future, the prices can vary, depending on the implementation of the Agreement on reduction of oil extraction. In January, the market will be awaiting information about the volume of oil production, and only toward the end of the month investors will be able to draw certain conclusions. It's not cost to expect significant price spikes until this moment – probably the rates will be in the frames of the current uptrend. The price can reach the level of 55-56 per barrel for the Light sweet/WTI.
    Oscillators MACD/Stochastics show a signal to open short deals, but at the moment, trading against the trend is not the best decision. It's be better to open the deals to BUY because there're no enough preconditions for a trend reversal and the prices have not reached yet the real maximum.

  5. #5
    Senior Member SuperForex's Avatar
    Join Date
    Dec 2016
    Posts
    423
    Analysis on the currency pair GBP / USD. Results of the year

    General analysis.
    In 2016 the currency pair GBP / USD was quite difficult.
    In terms of important fundamental data was a lot of key decisions from the UK and United States as well. his may include «Brexsit», Trump's election victory, increasing of the FED interest rate and even the OPEC decision to cut oil production.

    All these factors were a powerful catalyst for the pair GBP / USD and summing the dry residue we can said that the by the results of 2017 the currency pair GBP / USD has lost about 2300 points.

    First, the decision to Brexsit pulled the price down hit quite a long channel for GBP / USD. Further gradual strengthening of the dollar has continued to reduce the price to record lows and now the price is trading at 1.2270.

    The last two and a half years the pair is in the long-term downtrend and at the moment there are no preconditions to expect stop the decline.

    Speaking about the prospects for 2017 it should be noted that much will depend on global economic factors. The first important factor is the implementation of the OPEC countries agreements. If all goes according to plan and production significantly reduced, we can expect a reduction scenario to continue.

    Another important indicator will be the Fed's policy in terms of the rate increase. They promised next year to raise interest rates at least three times, which of course will continue to strengthen the dollar. However, they are unlikely to be addressed to increase the rate three times in one year.

    Graph 1


    Speaking about short and medium term at the moment on the graph, we see penetration of the price band downwards and fixing prices below the support level.

    Given the general downward trend on GBP / USD and the presence of signals for sale we can confidently expect continuation of decrease in the medium term.

    Now, there are all prerequisites for the so-called back-testing, from where the most profitable will be opened for sale.

    Graph 2


  6. #6
    Senior Member SuperForex's Avatar
    Join Date
    Dec 2016
    Posts
    423
    SuperForex Company wishes all traders a Happy New Year!
    The next year, we wish you to have only profit trades. We hope that the spirit of the holiday will bring you closer with your loved ones and fill your heart with kindness.
    Happy Holidays!


  7. #7
    Senior Member SuperForex's Avatar
    Join Date
    Dec 2016
    Posts
    423
    Technical analysis of the currency pair EUR/USD on 03/01/2017. The daily chart

    General analysis.
    Currency pair EUR / USD continues to move sideways during the whole last week.

    It should be reminded that not so long time ago the price has broken through the major support level 1.0520 and the price successfully fixed below it. Then it was back testing of this support but in time of testing there was a sharp surge in activity therefore the price has risen almost to 1.0670 but then during the same day again fell below the 1.0520 support.
    Considering the overall picture of the graph EUR / USD where we can emphasize a clear downward trend and the presence of such sell signals as: break through the price channel boundaries, back testing of it we can expect that further decline in this currency pair will continue.

    Schedule Stochastic indicator turned inside the neutral zone and demonstrates the downward movement.

    The following points to reduce the EUR will be the levels 1.0200 and 1.0180.
    We recommend opening the deal to sell with the average lots and placing orders S / L above 1.0650.


  8. #8
    Senior Member SuperForex's Avatar
    Join Date
    Dec 2016
    Posts
    423
    USD/SEK – review and short term forecast.
    At the moment, the market a calm due to New year's holidays. Market activity will be restored after completion of all holidays for at least a week. But by the end of the current week we expect important data from the US about the oil reserves, the unemployment level, which may slightly revive the market.
    On the chart of the USD/SEK we can see that the rates are in the frames of the uptrend, but there are perspectives of a trend change. Since November, has forming a flat trend. The support line has shifted and now it's in the horizontal position. Also on the chart we can see a trend reversal figure, however, at the moment the preconditions for a trend reversal is not enough. On the one hand, USD has not yet reached its peak and may continue to grow and strengthen in the new year, on the other hand, there are no preconditions for the strengthening of the SEK. The growth course of the Sweden economy has slowed, but the Riksbank decided to leave the refinancing rate unchanged on a very low level.
    Oscillator MACD shows a signal to open buy deals. This is the right decision upon medium-term trading.

  9. #9
    Senior Member SuperForex's Avatar
    Join Date
    Dec 2016
    Posts
    423
    Technical analysis of the currency pair EUR/СHF on 05/01/2017. The daily chart
    General analysis
    During the past two weeks the currency pair EUR / CHF continues to move sideways and has formed maximum at 30.12.16 – 1.0760. However, last trading week closed with a couple of black candlestick with a big body and it is contrary to growth opportunities.
    The first trading days of the current week was held under the auspices of the bulls and now we can see a return to growth.
    Price has not been able to go below support 1.0690 by forming a rebound from this level.
    A few weeks ago the price has already been successfully beat off from support level 1.0690. After obtaining several signals from other tools and indicators we can confidently expect the beginning of growth.
    Next few days
    Currency pair EUR / CHF is already moving sideways for a long time and at the moment we have a lot of reasons to expect the test of the upper boundary of the channel at 1.0790. However, given the resistance level at 1.0750 there is the probability forming of the peak and further decreases to the bottom of support 1.0690.
    After after overcoming of local maximum at 1.0750 we can consider to open a long deals with targert points by 1.0790.

  10. #10
    Senior Member SuperForex's Avatar
    Join Date
    Dec 2016
    Posts
    423
    Analysis on the currency pair EUR/JPY
    Today, all the world is waiting the jobs report from the USA after the Fed raised the interest rate in Dec 2016 for the second time after 12 months from the first one, and it’s expected that this report will effect on all symbols even EURJPY which we’ll analyze today.
    The EURJPY currency pair is trading now around 123.00 key resistance area which is in the middle zone between 38.2 and 50% fibo from the correction wave which started after the Brexit so, it maybe raise to 125 and back to down again the medium term trend but in the short term we’re expecting that will touch the upper limit of the wedge and back again, but the SMA 50’s slope is horizontal that’s mean the pair don’t have the power to resume the movement.
    The RSI and Stochastic indicators still giving us buy signs so we’ll wait for the sell signal to enter the market.
    The Next Few Days
    We can sell the pair when we see it around 123.50 and make our first target at 121.90 and if the pair broke the wedge we have to sell it again to 119.00, but on the other side if it broke it up we can buy it to 125.
    We have to be careful from the Non-Farm report today from the USA at 13:30 GMT Especially when we listened one of the statements from the FOMC minutes on Wednesday was the possibility of unemployment undershooting the level at which the central bank believes it should settle at in the long term.


Page 1 of 43 1 2 3 11 ... LastLast

Tags for this Thread

Bookmarks

Posting Permissions

  • You may not post new threads
  • You may not post replies
  • You may not post attachments
  • You may not edit your posts
  •