

ForeCastle
How to Trade Swings with Indicators
by
, 08-11-2014 at 04:10 AM (2155 Views)
Talking Points:
- Swing trading can be attractive due to the potentially strong risk-reward ratios available.
- Swings take place in range-bound and trending markets.
- We show traders how to trade swings in both environments using two different technical indicators.
When someone first begins to learn to trade, theyll often delve right into technical analysis. After all, if you can read a chart and get trade ideas directly from past price information, there is no need to learn any of the difficult stuff. The things like GDP reports, or inflation readings, or central bank announcements: The Macro-Economic events that will often help to shape the way that this world will continue to grow.
This is difficult just because there is so much of it. Many very bright young people will spend their entire lives studying economics and even then, they realize that the field is a very inexact science.
The shortest distance between two points is a straight line, and for most traders that straight line draws directly from technical analysis.
And right after learning candlesticks, traders will often begin moving into indicators to assist in interpreting that chart information. Trading is difficult enough, but when first encountering a chart most traders just see a bunch of squiggly lines. The indicator can help to make sense of that madness.
The first few indicators learned are often the basics. The moving average is often the first one learned because it is so simple; and then after that traders will usually move towards slightly more advanced, yet still basic indicators.
These traders will learn how the indicator can work, and may even place a few trades based on that indicator. This story almost always ends the same way as these new traders realize that the indicator doesnt always work, so they discard that one and move on to more advanced studies. This is a very unfortunate mistake.
The fact of the matter is that no tool, whether its an advanced indicator or something simple that you learned on your second day in markets is going to perfectly predict the future. Holy grails dont exist and regardless of how strong your analytical approach is any trade you place can end up costing you money.
This accentuates the importance of risk management: The future is uncertain regardless of how great of a trader you become. The difference between a professional and an amateur is that a professional knows what to do when theyre right and when theyre wrong, and an amateur doesnt. If you want more information on the topic, our Quantitative Strategist Mr. David Rodriguez outlines the importance and relevance of risk management in our DailyFX Traits of Successful Traders research. You can get the full guide at the link below completely free-of-charge.
So, if any trade brings along with it risk, and if the future is uncertain what does this say about the traders pursuit of profit?
This should illustrate that trading is more about probabilities than it is about direct prediction; with the goal being to get the probabilities in the traders favor, if even by just a little bit and this is where technical analysis comes in.
Using technical analysis can allow traders to take a look at what has happened in a market in an effort to get an idea for what may happen in that market. Notice that we didnt say predict or will happen. What follows are two ways that indicators can be used to look to initiate positions in the FX market.
Relative Strength Index
RSI is probably the most discarded indicator on the planet earth. While moving averages are often the first indicator learned, RSI usually follows closely thereafter. And after careful examination, traders will often realize that RSI (like any other indicator) isnt always right. So theyll often discard it, and move on to investigate other indicators (which all have the same issue of not being perfectly predictable).
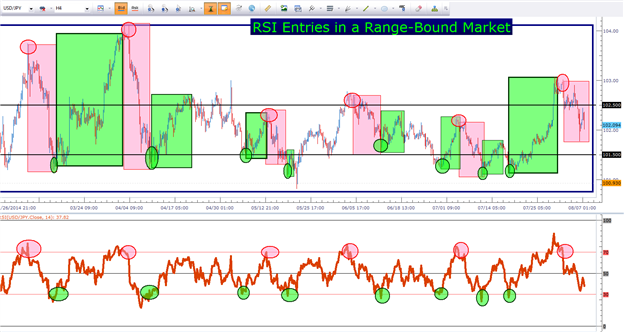
RSI, like any other indicator, has pluses and minuses. RSI can work fantastic in a range as an entry indicator; and traders can use this to trade swings in range-bound market conditions.
Traders can look to use RSI in the default manner, investigating short signals when the indicator crosses down and through 70, under the presumption that the market may be leaving overbought status; while investigating long signals with RSI crosses up and over 30 as the market leaves oversold status.
Trading the Range in USDJPY (4-hour chart) with RSI
How to Trade Swings within a Trend Using MACD
As we looked at above, RSI can be a fantastic way to trade swings within a range. But the fact-of-the-matter is that most traders avoid ranges like they were infested with bubonic plague. So I would be remiss in this article if I didnt touch on the most desired of the three market conditions: The trend.
To use an indicator to trade swings within a trending environment, were going to need some type of a filter to help us determine which direction to trade the trend. A common filter for this cause is the 200-day moving average; as many investment banks and hedge funds around-the-world use this indicator for the same purpose.
If prices are above the 200-day moving average, traders determine the trend to be up, in which case they look for opportunities to buy.
In the below image, were taking a look at GBPUSD over the past year; in which the pair has seen a brisk up-trend take prices from the 1.5500 vicinity, all the way up towards 1.7000. The 200-day moving average has been applied, and is showing in red on this 4-hour chart below.
MACD has also been applied, using the settings of 21, 55, and 9 periods respectively, and when the MACD crosses up and over the signal line a long position is considered. Because this is a trending strategy, the short signal from MACD (MACD crossing down and under the signal line) is used only to close the long position. No short positions are initiated here because the trend is classified as being up.
GBPUSD 4-hour chart (with 200-day Moving Average) Using MACD Trend-Side Entries
As you can see above, not every signal would have worked out perfectly. But in this year-long trend in GBPUSD, traders had numerous opportunities to jump on the long side when prices were low, and then to close the positions out after prices have swung higher.
--- Written by James Stanley
More...


- Categories
- Uncategorized
 Email Blog Entry
