

ForeCastle
Trading Reversals with CCI and Camarilla Pivots

by
, 09-07-2014 at 03:21 AM (1969 Views)
Talking Points
- CCI is a Classic Oscillator
- Traders Can use Overbought / Oversold Values
- Time Entries with Camarilla Pivots Levels
Timing entries is an important step to consider when developing a trading strategy. This is especially true for scalpers and day traders looking to take advantage of intraday market price swings and reversals. Normally, technical oscillators such as CCI (Commodity Channel Index) can be used in tandem with support and resistance to identify potential areas to enter the market. To do so, today we will review using CCI with camarilla pivots.
Overbought / Oversold CCI
CCI (Commodity Channel Index)
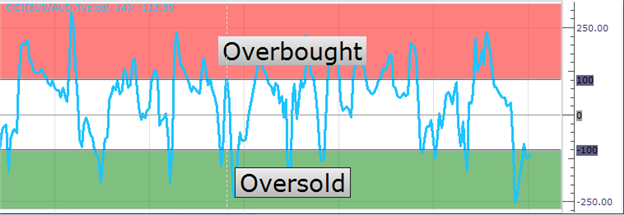
If you are already familiar with RSI, Rate of Change, or other oscillators you are one step closer to trading with CCI. Like many oscillators, CCI uses a mathematical equation to depict overbought and oversold levels for traders. Pictured below is CCI, which uses a +100 reading to indicator overbought conditions, while a reading below -100 represents an oversold level.
Normally 70-80% of the readings printed by CCI fall between overbought and oversold levels. Traditionally traders will wait for the market to move to an extreme and then use these values for buy or sell signals with momentum returning to the market. As with other overbought/oversold indicators, this means that there is a large probability that the price will correct to more representative price levels over time. Knowing this, reversal traders will wait for the indicator to move outside of one of these points before reverting back in the direction a support and resistance value. Now that you are familiarized with CCI, lets look at an example using the indicator in conjuncture with pivot points.
AUDUSD & CCI
Reversals & CCI
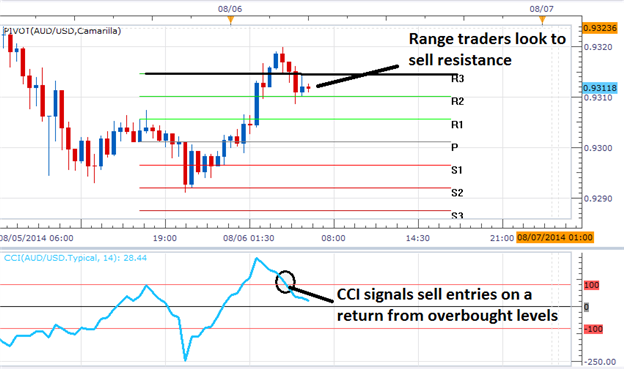
The use of support and resistance lines, such as camarilla pivots, can also be used in conjuncture with oscillators like CCI. The benefit of this, is that camarilla pivots outlines an area for traders to plan for a market reversal. Intraday resistance is typically found at the R3 resistance pivot, while support for the days range is found at the S3 pivot point.
The key to using CCI with camarilla pivots is to line an entry signal near support and resistance, along with an overbought or oversold reading of CCI.
Looking at the example above, we can see resistance formed at the R3 pivot near .9315. Instead of immediately entering into the market, traders can wait to take an entry signal when the indicator closes back below the +100 overbought area. The same can be said of price testing support. In the event that price bounces, traders can use the indicator to signal momentum of the market heading back up towards resistance.
---Written by Walker England, Trading Instructor
More...


Tags:
camarilla pivots,
cci,
overbought,
oversold

- Categories
- Uncategorized
 Email Blog Entry
