

ForeCastle
The Art of Keeping it Simple, or Any Indicator Is Really Just a Fancy Moving Average

by
, 08-12-2014 at 04:28 AM (1669 Views)
Talking Points:
- The moving average is easy to compute, and simple to chart.
- Moving averages can help to smooth out near-term noise and volatility.
- Moving averages can be used in a variety of ways, and we address the three most popular in this article.
Simplicity: The indicator’s job is to translate the price action over the relevant period of time (using the inputs selected by the trader or user) to arrive at a particular message.
The basis for all indicators
The moving average is probably the most simple to use and understand of all the major technical indicators. It’s simply the past x periods divided by x. This has a smoothing effect, as near-term price movements are registered in scope of the period of activity (x).
A wise man once told me: ‘Any indicator is really just a fancy moving average.’
This pretty much blew my mind the first time I heard it, because I had never looked at technical indicators in that way. But surely, upon realization, I understood what the gentleman was getting at. Pretty much every technical indicator is based on past price information (price action). And each indicator has its own mathematical function to derive its value based on that past price action; hence – any technical indicator using past prices is really just a different way of expressing a moving average.
It’s because of this simplicity that many traders, especially new ones, will often dismiss moving averages as part of their trading approach; under the premise that moving averages ‘don’t work.’
Well – by this tune, no indicator ‘works.’
Indicators, like price action, are just ways of looking at what’s happened in the past. And what’s happened in the past may help us to forecast the future, but you have to be honest with yourself in realizing that the past is never going to be perfectly predictive of the future. New events happen, and things change – and this is why technical analysis will never be a panacea; because it will never be a ‘holy grail.’
But it can help traders get the probabilities in their favor, if even just a little bit; so that those traders can use their trade, risk, and money management to give themselves the best chances of success in the market: Not chasing holy grails, because they don’t exist anyways.
Three Ways to Proactively Incorporate Moving Averages
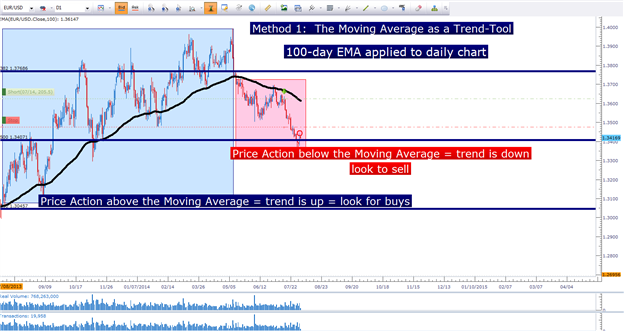
Moving averages can be a simple way to read and evaluate trends. With price action, this is a very subjective art of observing ‘higher-highs’ and ‘higher-lows.’ The moving average allows you to be objective around this analysis. You can definitively look at your chart and say – ‘this trend is up, so I want to buy,’ or ‘this trend is down so I want to sell.’
This is using a moving average as a trend-filter.
Using a 100-day EMA to denote trend in EURUSD (Daily Chart)
For this purpose, traders can simply apply the moving average to their chart, and look to price action to determine whether the trend is ‘up’ or ‘down.’
The next job is to find a way to enter in the direction of that trend. If the trend has been up, the trader generally wants to look to buy in an effort to get on the side of that bias if it were to continue. This entry can be done in a variety of ways after the trader has noted the up-trend.
Another moving average can be used, often on a shorter time frame or using smaller inputs.
Moving Averages can also be used to enter positions in the direction of momentum
Traders can also look to indicators like RSI, or MACD in an effort to buy or sell in the direction of the trend by simply waiting for a corresponding signal in the direction of the observed bias. So, for example – if the trader has determined the trend to be ‘up,’ from their moving average analysis – they can look to RSI or MACD to wait for a long-sided trigger.
Once that takes place, they can look to buy in anticipation of the longer-term trend coming back.
Lastly, traders can look to moving averages for potential support and resistance implications. One of the more interesting impacts of technical analysis is the idea of ‘self-fulfilling prophecies.’ For example, if enough traders are watching the 200-day moving average on EURUSD, and if those traders are waiting to sell until price runs up to the 200-day moving average (expecting resistance); as soon as that event takes place, and as soon as those traders sell, the additional selling orders bring on price declines. So, the relationship could be stated that price went down because the 200-day moving average reacted as resistance, but in reality there was a key component of that reaction (traders using the 200-day moving average as a trigger).
Common Moving Average Inputs can help to provide support and/or resistance to a market
This will generally only take place at ‘common’ moving averages. As in, it’s unlikely to see this effect as vividly on the 34-period EMA on the 1-minute chart as you might see on the 200-period moving average on the daily chart; simply because more traders are likely looking at the 200-day moving average versus the 34-minute average.
Common intervals for this type of support and resistance are the 10, 20, 50, 100, and 200 period moving averages as seen on the daily chart.
--- Written by James Stanley
More...


Tags:
moving average,
resistance,
support

- Categories
- Uncategorized
 Email Blog Entry
