Page 13 of 14 FirstFirst ... 3 11 12 13 14 LastLast
Results 121 to 130 of 132
Like Tree3Likes

Daily Market Analysis and Overview by Unitedpips

This is a discussion on Daily Market Analysis and Overview by Unitedpips within the Analytics and News forums, part of the Trading Forum category; EUR/USD Daily Analysis: Bulls Hesitate, Correction Looms Introduction to EUR USD The EUR/USD currency pair, also known colloquially as "Fiber," ...


  1. #121
    Member
    Join Date
    Oct 2024
    Posts
    132
    EUR/USD Daily Analysis: Bulls Hesitate, Correction Looms


    Introduction to EUR USD
    The EUR/USD currency pair, also known colloquially as "Fiber," represents the exchange rate between the Euro and the US Dollar. It's one of the most widely traded forex pairs globally, influenced heavily by economic indicators from the Eurozone and the United States. Traders and investors closely monitor EUR/USD for insights into market sentiment, currency strength, and economic health across the Atlantic.


    EURUSD Market Overview
    EUR-USD has been experiencing fluctuating movements, currently showing signs of consolidation after significant bullish momentum. Recent speeches from Federal Reserve officials, including Governor Michelle Bowman and Dallas Fed President Lorie Logan, could provide clues regarding future monetary policy shifts and impact USD strength positively if hawkish signals are observed. Meanwhile, Eurozone traders are anticipating key economic releases, including inflation data (CPI), unemployment rates, and GDP estimates from major European economies such as Germany, France, and Italy. Positive results in these economic indicators may bolster EUR's value. However, any hawkish rhetoric from upcoming Fed speeches and strong USD economic reports might tip the scale in favor of the US Dollar.


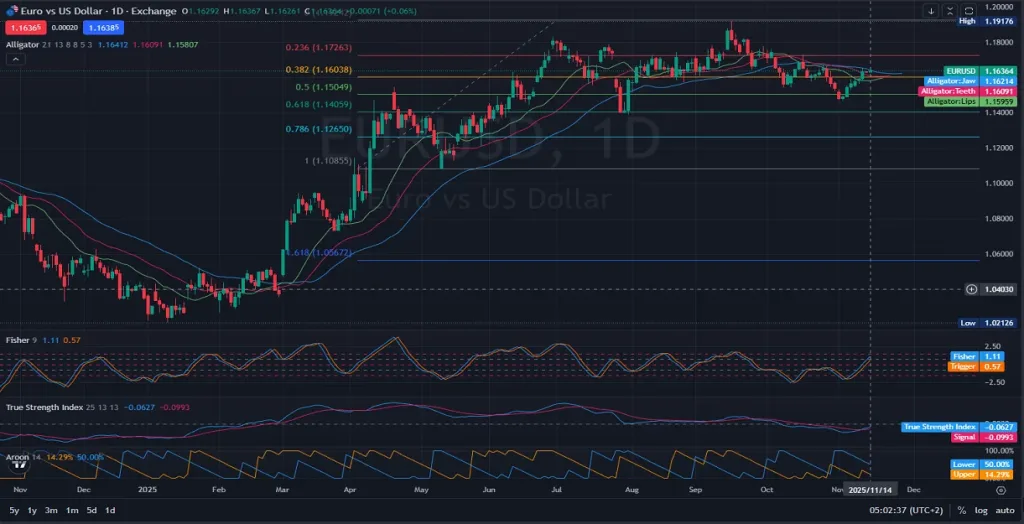
    EUR/USD Technical Analysis
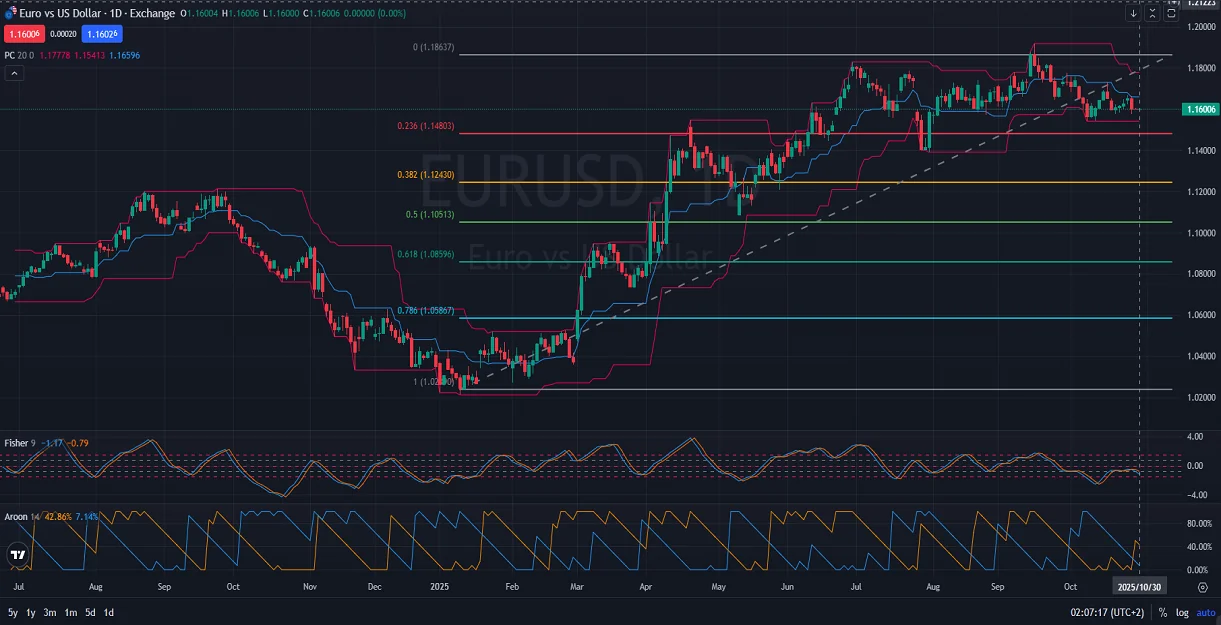
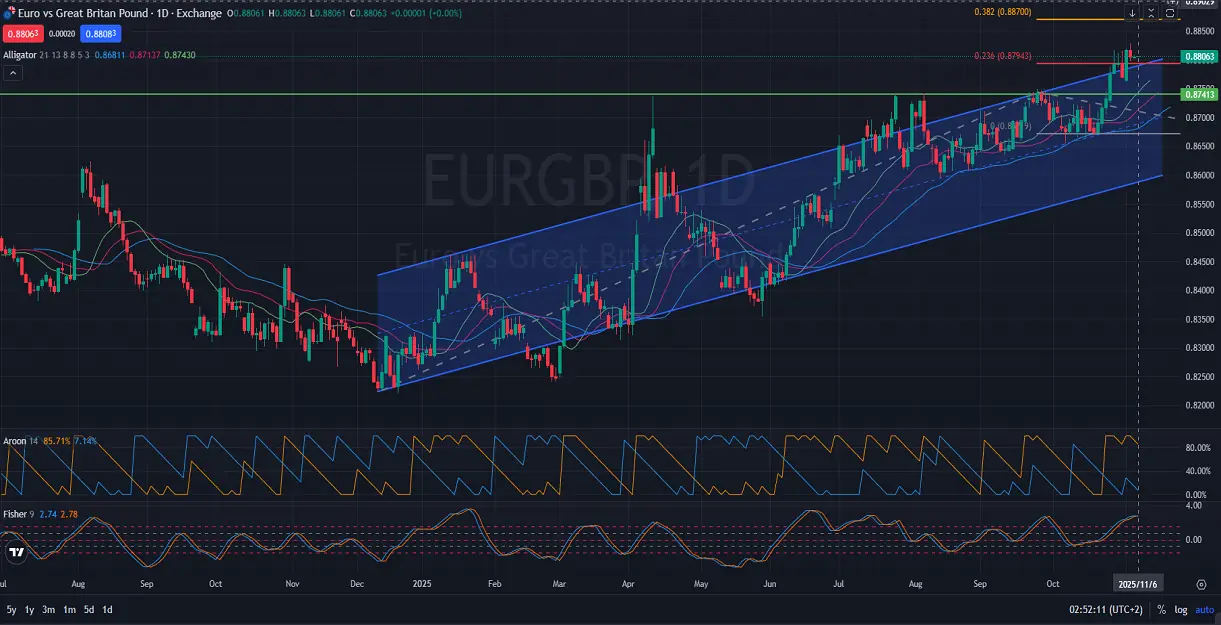
    EUR USD is currently showing indecisiveness, trading in a sideways channel following a significant bullish rally. Candlesticks have settled below the middle band of the price channel, indicating a potential shift toward a bearish correction. Technical indicators suggest caution: the Fibonacci retracement level at 0.236 (around 1.14803) may be a viable downside target if bearish momentum resumes. Conversely, bullish continuity could see the pair retest its recent high at approximately 1.18637. Additionally, the Fisher indicator stands at -1.17 and -0.79, signaling downward pressure, while the Aroon indicator shows values of 42.86% for uptrend and 7.14% for downtrend, further highlighting market indecision and potential bearish tendencies.


    Final Words About EUR vs USD
    Given the mixed signals from technical indicators and significant upcoming economic events, traders should remain cautious and closely monitor forthcoming data releases from both regions. The EUR/USD pair could see increased volatility driven by central bank rhetoric, inflation updates, GDP reports, and employment data. Risk management remains essential, as unexpected results from either side could rapidly shift market sentiment. Maintaining an adaptive trading strategy in response to evolving market conditions is recommended.


    Disclaimer: This EURUSD analysis, provided by Unitedpips, is for informational purposes only and does not constitute trading advice. Always conduct your own Forex analysis before making any trading decisions.


    10.30.2025

  2. #122
    Member
    Join Date
    Oct 2024
    Posts
    132
    EUR/JPY Forecast: Will the Euro Hit 180 Against the Yen?


    Introduction to EUR/JPY
    The EUR/JPY currency pair—often referred to as “the Dragon”—represents the exchange rate between the Euro (EUR) and the Japanese Yen (JPY). It’s one of the most traded pairs in the forex market, known for its volatility and trend-driven movements. The pair attracts both short-term traders and long-term investors due to its sensitivity to global risk sentiment, monetary policy divergence between the European Central Bank (ECB) and the Bank of Japan (BoJ), and macroeconomic data releases from both regions.


    EUR/JPY Market Overview
    As of the latest daily analysis, the Euro is showing resilience against the Japanese Yen, supported by improving inflation indicators in the Eurozone and expectations of steady consumer spending data. The European side has seen a string of important economic indicators—such as Germany’s Import Price Index, Real Retail Sales, and multiple Consumer Price Index (CPI) releases from France, Italy, and the Eurozone—suggesting stable price growth momentum. This reinforces expectations that the ECB will maintain a cautious but steady monetary stance. Meanwhile, in Japan, attention is on Tokyo’s CPI and unemployment rate releases, both scheduled for November 28, 2025, alongside data from METI and MLIT covering industrial production, retail trade, and housing starts. These upcoming reports will shed light on the strength of Japan’s domestic recovery. However, with inflationary pressures still subdued, the Bank of Japan’s ultra-loose policy remains a drag on the Yen. As a result, EUR/JPY continues its bullish momentum, trading close to multi-year highs around the 178.00–179.00 zone.


    EUR/JPY Technical Analysis
    On the daily timeframe (D1), the EUR/JPY pair is moving within a strong ascending trend, respecting the rising trendline visible since late 2024. The price currently trades in the upper half of the Donchian Channel, with the upper band positioned around 178.80, indicating bullish control. The Fisher Transform indicator shows the Fisher line at 2.24 and the Trigger line at 1.96, confirming strong bullish momentum and suggesting continued upward pressure. Additionally, the Rate of Change (ROC) stands at 1.40, reinforcing the pair’s ongoing strength and positive price acceleration. The rising trendline near 166.00–168.00 acts as long-term support, while the Donchian basis line at 175.50 offers intermediate backing. Resistance is seen at 179.00, a psychological level that could trigger consolidation or a short-term correction. If the pair breaks above this resistance, it could target the 180.50–182.00 region, marking new yearly highs.


    Final Words about EUR vs JPY
    The Euro vs Japanese Yen (EUR/JPY) pair maintains a bullish outlook in the short to medium term. Market sentiment favors the Euro as inflation readings remain steady across major Eurozone economies, supporting a stable policy outlook from the ECB. On the other hand, Japan’s data suggests a continuation of accommodative policy, weighing on the Yen’s strength. Traders should monitor upcoming CPI and retail data releases from both regions, as these could reinforce or challenge the current momentum. Overall, as long as EUR/JPY holds above the 175.00–175.50 support zone, the bias remains upward, with potential targets extending toward 180.00–182.00 in the coming weeks. A decisive daily close above the 179.00 resistance could confirm further bullish continuation toward new highs.


    Disclaimer: This EURJPY analysis, provided by Unitedpips, is for informational purposes only and does not constitute trading advice. Always conduct your own Forex analysis before making any trading decisions.


    10.31.2025

  3. #123
    Member
    Join Date
    Oct 2024
    Posts
    132
    GOLD/USD Analysis: Sideways Movement Amid Bearish Signals


    Introduction to GOLDUSD
    The GOLD/USD pair, commonly known as XAU/USD, represents the price of gold per ounce quoted in US dollars. Known as a safe-haven asset, gold is often traded as protection against market volatility and inflation. Traders and investors track GOLD-USD closely to understand global economic stability and monetary policy shifts.


    GOLD USD Market Overview
    Currently, GOLD/USD is experiencing sideways movement with a mildly bearish bias. Market sentiment is influenced by recent statements from Federal Reserve Governor Michelle Bowman, expected at the Santander International Banking Conference, potentially indicating a hawkish stance beneficial for the USD. Additionally, consumer sentiment data from RealClearMarkets shows mixed economic confidence, affecting the USD's strength and indirectly impacting gold prices. These factors lead investors to cautiously observe economic developments to gauge future gold movements. Traders should closely monitor upcoming USD-related news releases, as these will significantly impact GOLD dynamics over the coming days.


    GOLD/USD Technical Analysis
    From a technical perspective, GOLD/USD has been consolidating around the Fibonacci retracement level of 0.382 at approximately $3966.91. The price action in recent candles indicates significant resistance at this Fibonacci level, supported by a noticeable bearish tilt. The Alligator indicator shows the green Lips line positioned at the top but trending downward, with the red Teeth line flat near the price, and the blue Jaw line gradually rising. The Fisher indicator signals bearish sentiment with values at -1.38 (Trigger line) and -1.41 (Fisher line), while the Rate of Change (ROC) indicator is at -3.30, suggesting negative momentum and potential further downside in the short term.


    Final Words About GOLD vs USD
    Considering the prevailing technical indicators and market sentiment, GOLD/USD is likely to maintain its sideways trend with a potential for bearish breakouts. Traders must pay close attention to upcoming economic indicators and Federal Reserve announcements, as these could create volatility and directional shifts. Risk management strategies should be prioritized, given gold’s sensitivity to global financial events and USD strength fluctuations. Continuous monitoring of Fibonacci retracement levels and Alligator indicator dynamics will provide critical insights for decision-making.


    Disclaimer: This GOLD analysis, provided by Unitedpips, is for informational purposes only and does not constitute trading advice. Always conduct your own Forex analysis before making any trading decisions.


    11.04.2025

  4. #124
    Member
    Join Date
    Oct 2024
    Posts
    132
    EUR/USD Faces Pressure Ahead of Key US Data


    Introduction to EUR/USD
    The EUR USD pair, often called the "Fiber," is one of the most traded currency pairs in the global forex market. It reflects the value of the Euro against the United States Dollar and serves as a key indicator of global economic sentiment. Traders watch EUR/USD closely because it represents two of the world’s largest economies—the Eurozone and the United States—making it highly liquid and sensitive to geopolitical and macroeconomic developments. Understanding the EUR/USD pair’s behavior helps investors assess the strength of both currencies and forecast potential market movements.


    EUR USD Market Overview
    The EURUSD pair is currently facing bearish pressure as the US Dollar gains strength ahead of key US employment and services data releases. The latest ADP Employment Change, ISM Services PMI, and S&P Global Services PMI figures have reinforced expectations of a stable US labor market and resilient economic growth. This has supported the US Dollar, as traders anticipate that the Federal Reserve may delay rate cuts. Meanwhile, the Euro is under mild pressure, as recent data from Eurostat and Destatis suggest subdued industrial activity across the Eurozone, with German factory orders remaining weak. European Central Bank (ECB) policymakers, including Bundesbank President Joachim Nagel, are expected to speak soon, possibly hinting at the ECB’s next monetary direction. As of now, the EUR/USD pair trades around 1.1480, hovering near its short-term support zone, with traders awaiting clearer signals from both economies.


    EUR-USD Technical Analysis
    From a technical standpoint, the EUR/USD daily chart shows that the pair recently peaked near 1.18637 before entering a sustained bearish phase. The price has now retraced toward the 0.236 Fibonacci level (1.14803), an area that has previously served as both support and resistance. This suggests potential consolidation or a short-term corrective bounce; however, bearish momentum remains dominant. The Awesome Oscillator (AO) currently reads -0.01445, confirming weakening bullish momentum, while the Chaikin Oscillator at -45.351K signals that selling pressure remains strong. Additionally, the Moving Average Channel sits above current price levels, reinforcing the bearish bias. A sustained break below 1.1480 could open the path toward deeper retracements at 1.1243 (38.2% Fibonacci) and 1.1051 (50% Fibonacci), while a rebound above 1.1600 would be needed to challenge the downtrend.


    Final Words about EUR vs USD
    The Euro vs US Dollar pair is in a delicate position as the bearish trend consolidates around a crucial support zone. While the Euro could find short-term relief if European data or ECB commentary turns more optimistic, the stronger US employment outlook and stable services sector keep the Dollar in control. Traders should monitor the upcoming ADP Employment Change and ISM Services PMI closely, as any upside surprises could trigger further downside for EUR/USD. Overall, the pair’s technical and fundamental setups align toward continued bearish sentiment in the near term, with potential volatility around key economic releases. As always, maintaining disciplined risk management and staying informed of central bank developments will be vital for navigating this volatile pair.


    Disclaimer: This EURUSD analysis, provided by Unitedpips, is for informational purposes only and does not constitute trading advice. Always conduct your own Forex analysis before making any trading decisions.


    11.05.2025

  5. #125
    Member
    Join Date
    Oct 2024
    Posts
    132
    EUR/GBP Price Forecast: Central Banks Drive Market Sentiment


    Introduction to EURGBP
    The EUR/GBP pair, commonly known among traders as "Chunnel," reflects the exchange rate between the Euro and the British Pound. As a critical indicator of economic health in Europe and the UK, this currency pair is heavily influenced by economic policies from the European Central Bank (ECB) and the Bank of England (BOE). EUR/GBP is favored among traders seeking exposure to the relative strength of Europe's two most significant economies without involving the volatility of the US dollar.


    EUR GBP Market Overview
    EURGBP currently shows bullish momentum driven by recent economic releases and central bank statements. The Bank of England’s recent Monetary Policy Report indicated a cautiously optimistic outlook, maintaining stable interest rates and signaling no immediate policy shifts. BOE Governor Andrew Bailey’s statements remained neutral to slightly hawkish, offering subtle support to GBP. On the Euro side, anticipation surrounds upcoming data releases from Destatis and Eurostat, particularly industrial production and retail sales, which traders predict will influence the ECB's monetary stance. Upcoming statements from Deutsche Bundesbank President Joachim Nagel may provide additional insights into potential ECB policy shifts, which could add volatility to EUR/GBP.


    EUR/GBP Technical Analysis
    Examining the EUR GBP daily chart, the pair exhibits clear bullish movement within an ascending channel, recently accelerating to a steeper trajectory, suggesting stronger bullish sentiment. Currently, the price action is approaching the 0.382 Fibonacci expansion level, which could serve as significant resistance before initiating a correction. Should a retracement occur, traders may anticipate the price returning towards the support level around 0.87413. The Williams Alligator indicates a bullish alignment with expanding jaws, while the Aroon indicator confirms bullish dominance. The Fisher Transform also remains positive, highlighting continued buyer confidence.


    Final words about EUR vs GBP
    In conclusion, EUR/GBP is likely to maintain its bullish stance in the short term, with traders closely watching the Fibonacci levels for possible corrections. Upcoming economic data and central bank communications will be crucial in determining whether the bullish trend sustains or faces substantial resistance. Traders should remain vigilant for signs of weakening bullish momentum around key technical levels and economic announcements. Prudent risk management is essential due to the potential volatility influenced by ECB and BOE decisions. Continued monitoring of economic indicators from both regions is recommended for informed trading decisions.


    Disclaimer: This EURGBP analysis, provided by Unitedpips, is for informational purposes only and does not constitute trading advice. Always conduct your own Forex analysis before making any trading decisions.


    11.06.2025

  6. #126
    Member
    Join Date
    Oct 2024
    Posts
    132
    USD/JPY Technical Analysis: Bulls Target 2025 Highs


    Introduction to USD/JPY
    USD/JPY, commonly known as "The Ninja," represents the trading dynamic between the US Dollar and Japanese Yen. As a major forex pair, USDJPY is pivotal in forex trading due to its significant liquidity and volatility. Traders frequently monitor this pair to understand the overall risk sentiment and economic health between the robust U.S. economy and Japan's influential export-driven economy.


    USD-JPY Market Overview
    Currently, USD-JPY is experiencing an upward corrective movement, continuing its recovery from declines earlier in the year. Recent US economic news includes the NFIB Small Business Index, which influences investor sentiment by indicating business confidence and economic strength. Today, US banks are closed in observance of Veterans Day, potentially leading to decreased market liquidity and irregular volatility for the pair. On the Japanese side, the latest reports from the Bank of Japan indicate stability in bank lending, which could strengthen the Yen if consumer and business spending remain optimistic. Upcoming news regarding Japan's current account balance and the government bond auction results will further impact the pair, as they reflect investor confidence and demand for Yen assets.


    USD JPY Technical Analysis
    On the daily chart, USD JPY is currently in a bullish corrective phase, ascending towards key resistance levels established since July 2024. The price is testing a critical resistance area around the Fibonacci 0.618 retracement level near 153.500. Successfully breaking this level could propel USD/JPY upwards, targeting the 0.786 Fibonacci retracement near 157.174 and potentially retesting the yearly high at 158.868 recorded on January 9th, 2025. Indicators show strong bullish momentum, with the Alligator indicator suggesting a continued upward trend—the green lips above the red teeth and blue jaw indicate bullish momentum. Additionally, the Fisher indicator at 1.47 (trigger) and 1.37 (Fisher) signals ongoing bullish sentiment.


    Final words about USD vs JPY
    The USD-JPY is exhibiting strong bullish signals in the short term, backed by technical indicators and current market sentiment. Traders should closely monitor the crucial resistance around the 153.500 level, as its breach could lead to significant upward momentum. Additionally, attention should be paid to the upcoming economic releases from both the US and Japan, particularly concerning liquidity variations and investor confidence. Maintaining vigilance on these fundamental factors and employing robust risk management strategies is advised due to potential volatility and market uncertainties.


    Disclaimer: This USDJPY analysis, provided by Unitedpips, is for informational purposes only and does not constitute trading advice. Always conduct your own Forex analysis before making any trading decisions.


    11.11.2025

  7. #127
    Member
    Join Date
    Oct 2024
    Posts
    132
    AUD/USD Technical Outlook: Channel Break Signals Bearish Move


    Introduction to AUD USD
    The AUD/USD currency pair, commonly known as the "Aussie," tracks the exchange rate between the Australian Dollar and the US Dollar. This pair is highly influenced by commodity prices, economic data from both countries, and monetary policy decisions by their respective central banks. Traders and investors closely monitor the Aussie as an indicator of global economic sentiment and commodity market health.


    AUD/USD Market Overview
    Currently, the AUD-USD pair is experiencing increased volatility driven by recent statements from key Federal Reserve members and upcoming engagements by Reserve Bank of Australia (RBA) officials. Several Federal Open Market Committee (FOMC) members, including Michael Barr, John Williams, Anna Paulson, Christopher Waller, Raphael Bostic, and Stephen Miran, are scheduled to speak about economic policies, potentially influencing USD strength. Hawkish comments from these Fed members generally support the USD, increasing downward pressure on the Aussie. Additionally, the RBA Assistant Governor Brad Jones's upcoming remarks on financial stability will be closely watched, as any hawkish stance could provide temporary support to the Australian dollar. The mixed market sentiment highlights uncertainty and the potential for significant price swings in AUD/USD.


    AUDUSD Technical Analysis
    Analyzing the AUD USD daily chart, we observe the pair has recently broken out of a long-term corrective bullish channel, suggesting a bearish continuation is likely. Given the overall bearish sentiment in the market, the next potential target could be the 0.236 Fibonacci extension level, reinforcing bearish pressure. On the upside, any bullish recovery would first need to overcome the immediate red resistance line before confirming any potential reversal or bullish momentum. Indicators such as the Accelerator Oscillator (AO) and Fisher Transform indicate mixed signals, reflecting the current indecision and volatility within the pair. Traders should closely watch these indicators for confirmation signals before entering new positions.


    Final Words about AUD vs USD
    In conclusion, AUD/USD is currently biased towards the downside, influenced heavily by the ongoing rhetoric from US Federal Reserve officials and the technical breakout from the bullish channel. Traders should remain vigilant regarding any comments from FOMC and RBA officials, as these have the potential to significantly influence the pair's direction in the short term. Technically, price action supports a cautious bearish outlook, but a reversal cannot be entirely ruled out if key resistance levels are breached convincingly. Managing risk carefully remains crucial amid these volatile market conditions.


    Disclaimer: This AUDUSD analysis, provided by Unitedpips, is for informational purposes only and does not constitute trading advice. Always conduct your own Forex analysis before making any trading decisions.


    11.12.2025

  8. #128
    Member
    Join Date
    Oct 2024
    Posts
    132
    EUR/GBP Daily Analysis: Approaching Crucial Resistance Level


    Introduction to EURGBP
    EUR/GBP, known colloquially as the "Chunnel," represents the exchange rate between the Euro and the British Pound. Traders pay close attention to this pair due to the economic significance of both currencies within Europe and globally. EUR/GBP provides insights into the relative strength of the Eurozone and the United Kingdom economies, aiding traders in strategic investment and hedging decisions.


    EUR GBP Market Overview
    Currently, EURGBP is experiencing bullish momentum driven by recent economic reports and global market sentiments. The UK's latest RICS House Price Balance data, reflecting property market inflation, could provide near-term support for the British Pound. Additionally, upcoming GDP and manufacturing data from the UK will significantly impact the pair’s movement, potentially providing strength to GBP if positive surprises occur. On the Euro side, attention turns to the next ECB statistical bulletin and industrial production figures, which could further bolster the Euro if reports exceed expectations. Traders should also watch the upcoming ECOFIN meeting on December 12, 2025, as discussions on financial policies could significantly affect the Eurozone's economic outlook.


    EUR/GBP Technical Analysis
    The daily chart for EUR GBP reveals a sustained bullish trend, despite minor indications of weakening momentum. Current price action suggests continued bullish sentiment with potential to target the historically significant resistance level at 0.89080. Indicators such as Fisher (9) at 2.42, above its previous reading of 2.09, signal ongoing bullishness. Conversely, the Chaikin Oscillator at -5.309K suggests underlying selling pressure, hinting at caution among buyers. Nevertheless, a decisive break above the resistance at 0.89080 could confirm further upside potential in EUR/GBP.


    Final words about EUR vs GBP
    EUR/GBP remains bullish in the short-term, driven by supportive economic data and market conditions. Traders should closely monitor resistance at 0.89080 for potential breakout opportunities or reversals. Upcoming economic data releases from both the UK and the Eurozone will be crucial in guiding future price movements. Maintaining an awareness of market sentiment and technical indicators is essential, as increased volatility around economic announcements could lead to swift market adjustments. Risk management strategies should remain in place due to potential shifts in market dynamics.


    Disclaimer: This EURGBP analysis, provided by Unitedpips, is for informational purposes only and does not constitute trading advice. Always conduct your own Forex analysis before making any trading decisions.


    11.13.2025

  9. #129
    Member
    Join Date
    Oct 2024
    Posts
    132
    EUR-USD Attempts Bullish Breakout at Key Fib Level


    Introduction to EURUSD
    The EURUSD currency pair—often called the “Fiber”—represents the exchange rate between the euro and the United States dollar. As the world’s most traded forex pair, it reflects the strength and economic outlook of the two largest global economies. Because of its high liquidity and tight spreads, EUR USD is a favorite among day traders and institutional investors alike. Monitoring the pair's daily movements helps traders understand macroeconomic trends and market sentiment.


    EUR/USD Market Overview
    As of November 14, 2025, the EUR-USD pair is exhibiting cautious bullish behavior after a period of recent consolidation. On the European side, key economic indicators have shown some stabilization: the final Consumer Price Index (CPI) data released by INSEE confirmed steady inflationary pressures, which supports the euro. In addition, Eurostat's recent labor and GDP updates suggested slight improvements in employment and economic activity. Eurozone trade data, although somewhat lagging, continues to show a mild surplus, which can favor the currency. Meanwhile, on the U.S. side, investor attention is focused on the latest commentary from Federal Reserve members at the Joint Energy Conference. Hawkish tones from FOMC voting members like Jeffrey Schmid and Lorie Logan are causing some short-term pressure on the euro, though the absence of fresh inflation surprises from the U.S. keeps the EUR/USD balanced for now.


    EUR USD Technical Analysis
    The EUR USD daily chart shows the pair recovering from its recent lows, currently trading around the 1.1636 level. From the beginning of 2025 at around 1.0212, the price surged to a high of 1.1917 by September, indicating strong bullish momentum earlier in the year. Recently, however, the pair retraced and is now testing resistance near the 0.382 Fibonacci retracement level at 1.1603. The Alligator indicator shows a mixed structure: the blue jaw is on top, followed by the red teeth and the green lips, suggesting a recent bearish structure, though the green lips are now curling upwards—hinting at a potential bullish crossover if upward momentum continues. The Fisher 9 oscillator is currently at 1.11, above the trigger line at 0.57, supporting the bullish case. Additionally, the True Strength Index (TSI) has made a crossover above the signal line, though both are still in negative territory, indicating recovering momentum but not a full trend reversal yet. The Aroon indicator further shows weakness in the uptrend, with the Aroon Upper at only 14.29% and Aroon Lower at 50%, signaling a lack of strong bullish confirmation.


    Final Words About Euro vs US Dollar
    In summary, the EUR/USD pair is currently navigating a critical technical zone after bouncing from recent lows. While eurozone fundamentals such as CPI and GDP are showing signs of stability, the pair remains sensitive to U.S. monetary policy rhetoric, especially from FOMC members. A breakout above the 1.1603 resistance (0.382 Fibonacci level) could target the 1.1726 area (0.236 Fib) next, while failure to gain traction may lead to a retest of support around the 1.1405 (0.618 Fib) zone. Traders should continue monitoring both economic data and central bank commentary closely, as these will heavily influence short-term direction. With momentum indicators turning slightly bullish but still mixed, caution is advised for both breakout and range traders in the current environment.


    Disclaimer: This EURUSD analysis, provided by Unitedpips, is for informational purposes only and does not constitute trading advice. Always conduct your own Forex analysis before making any trading decisions.


    11.14.2025

  10. #130
    Member
    Join Date
    Oct 2024
    Posts
    132
    GOLD/USD Consolidates Below All-Time High Resistance


    Introduction to GOLD-USD
    The GOLD-USD pair, commonly referred to as XAU USD, represents the value of one troy ounce of gold in terms of the US Dollar. Often seen as a safe-haven asset, XAU/USD is one of the most actively traded commodities in global financial markets. Gold is frequently used as a hedge against inflation, economic uncertainty, and geopolitical tensions, which makes its behavior crucial during periods of financial volatility. Traders closely monitor this pair for both long-term investment strategies and short-term trading opportunities.


    GOLD Market Overview
    The XAU/USD daily market continues to reflect high sensitivity to recent US economic developments and Federal Reserve commentary. Several key events are shaping current market sentiment. Today, multiple Federal Reserve officials-including Governor Waller and Richmond Fed President Thomas Barkin-are scheduled to speak on monetary policy and economic outlooks. These speeches are likely to hint at future interest rate paths, which heavily influence gold pricing. Additionally, upcoming reports delayed by the recent US government shutdown, such as the Durable Goods Orders and the Treasury Budget, are now approaching their new release dates, further adding to market anticipation. As gold typically moves inversely with interest rates and the USD, traders are cautiously awaiting these cues, especially after the recent hawkish tone from policymakers. For now, gold/usd remains range-bound, digesting mixed fundamentals from both the inflation outlook and fiscal signals.


    GOLD/USD Technical Analysis
    On the daily chart, GOLD/USD (XAU/USD) is showing a sideways price action between the psychological support level near $4,000 and the all-time high resistance at $4,379.14. Price is currently hovering just below the center price line at $4,132.78, suggesting a slight bearish inclination in the near term. The Price Channel indicator reflects horizontal movement, with the high-price line flat at the ATH and the low-price line steady near $3,886.41. A potential test of the lower channel boundary could occur if current sentiment remains weak. Additionally, the Fisher Transform indicator shows both the trigger (0.62) and Fisher line (0.34) pointing downward, signaling fading bullish momentum. The Aroon indicator shows the Aroon Up at 78.57% and Aroon Down at 7.14%, indicating that while a recent uptrend remains in play, its strength may be weakening as no new highs have been confirmed in recent sessions.


    Final Words About GOLD vs. USD
    In summary, GOLD/USD (XAU/USD) is consolidating within a defined range as traders await fresh catalysts from the US economic calendar and speeches by key policymakers. While the long-term uptrend remains intact given the metal’s position above major support levels, short-term technicals indicate a possible pullback toward the lower boundary of the price channel. The balance between hawkish Fed commentary and lagging economic data will determine whether gold can break above resistance or slide toward support. Traders should closely watch upcoming data releases and volatility signals for actionable trade setups. For now, caution is warranted, especially with gold lingering near key mid-channel levels without strong directional conviction.


    Disclaimer: This GOLDUSD analysis, provided by Unitedpips, is for informational purposes only and does not constitute trading advice. Always conduct your own Forex analysis before making any trading decisions.


    11.18.2025

Page 13 of 14 FirstFirst ... 3 11 12 13 14 LastLast

Bookmarks

Posting Permissions

  • You may not post new threads
  • You may not post replies
  • You may not post attachments
  • You may not edit your posts
  •