Page 11 of 12 FirstFirst ... 9 10 11 12 LastLast
Results 101 to 110 of 114
Like Tree2Likes

Daily Market Analysis and Overview by Unitedpips

This is a discussion on Daily Market Analysis and Overview by Unitedpips within the Analytics and News forums, part of the Trading Forum category; XAG/USD Approaches Critical Resistance Amid Fed Speeches Introduction to XAG/USD The XAGUSD pair, commonly referred to as Silver Spot, represents ...


  1. #101
    Member
    Join Date
    Oct 2024
    Posts
    114
    XAG/USD Approaches Critical Resistance Amid Fed Speeches


    Introduction to XAG/USD
    The XAGUSD pair, commonly referred to as Silver Spot, represents the value of silver measured against the US dollar. It is a popular trading instrument among commodity traders due to silver's intrinsic value and volatility. Tracking XAG/USD provides insights into precious metal market sentiment and the relative strength of the US dollar. Traders often use this pair as an inflation hedge and a reflection of economic confidence.


    XAG-USD Market Overview
    The silver market has recently seen significant bullish momentum, approaching price levels not visited since 2011. However, the upcoming speeches from prominent Federal Reserve members, including John Williams, Alberto Musalem, Stephen Miran, Thomas Barkin, and Beth Hammack, could introduce substantial volatility. Their discussions, particularly if hawkish, might strengthen the US dollar, potentially pressuring silver prices downward in the short term. With high-level economic discussions scheduled, traders should closely monitor any hints regarding future US monetary policy and interest rate expectations. This scenario creates an environment ripe for potential corrective moves in XAG/USD, driven by dollar strength and market caution.


    XAGUSD Technical Analysis
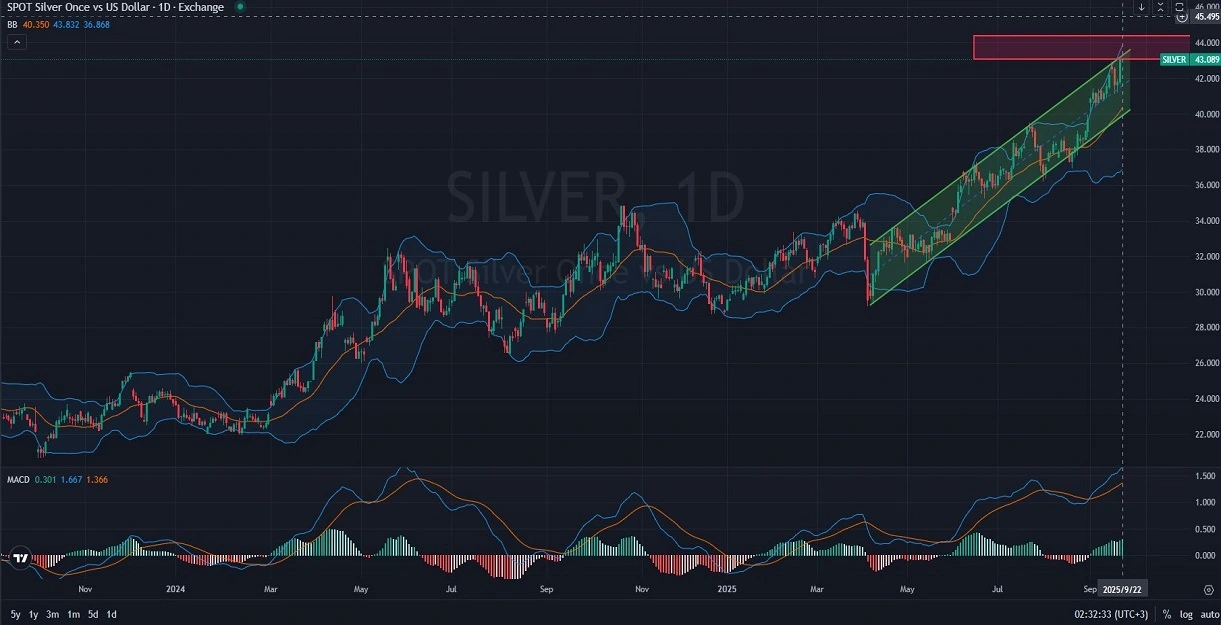
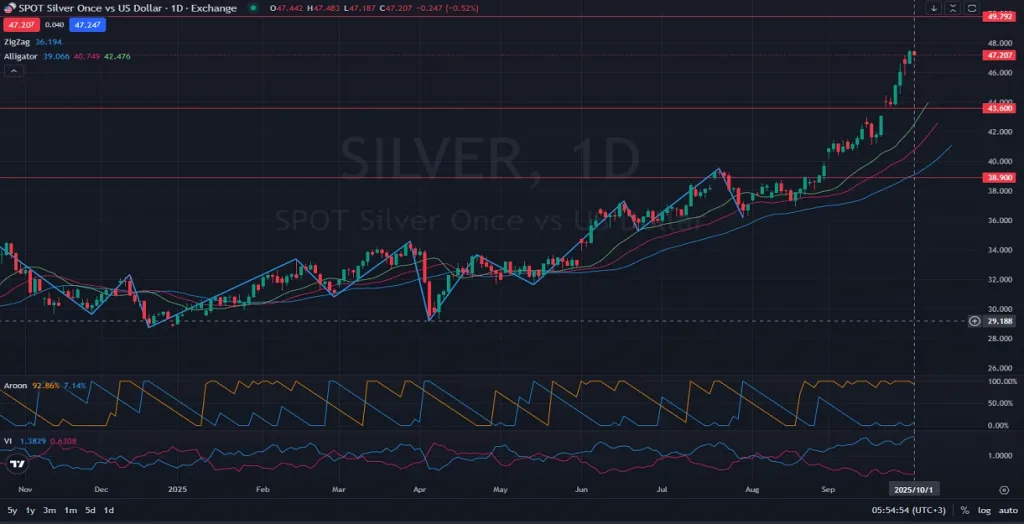
    On the daily timeframe, XAG-USD is currently testing a critical resistance zone last reached in 2011, signaling potential exhaustion in the current bullish trend. The MACD indicator exhibits a positive histogram, suggesting strong upward momentum; however, caution is warranted as prices near such historically significant resistance. Bollinger Bands have expanded notably, signaling heightened volatility and indicating a possible upcoming corrective phase. Price action also suggests that a retreat toward at least the middle Bollinger band or the midpoint of the upward channel could soon commence. Traders should anticipate potential pullbacks and watch for confirmation through bearish candlestick patterns or MACD weakening.


    Final Words about XAG vs USD
    Considering the robust bullish run and historical resistance levels, a short-term correction in XAG/USD seems likely. Traders should prepare for increased volatility driven by Federal Reserve policy communications. It is critical to manage risk carefully at these elevated levels, closely monitoring support and resistance lines and key technical indicators for reversal signals. While silver’s long-term prospects remain positive given inflationary concerns, short-term fluctuations tied to US monetary policy and dollar strength may dominate immediate price action.


    Disclaimer: This XAGUSD analysis, provided by Unitedpips, is for informational purposes only and does not constitute trading advice. Always conduct your own Forex analysis before making any trading decisions.


    09.22.2025

  2. #102
    Member
    Join Date
    Oct 2024
    Posts
    114
    BTC/USD Facing Critical Support Amid Economic Uncertainty


    Introduction to BTCUSD
    The BTC/USD pair, commonly known as "digital gold," represents the exchange rate between Bitcoin, the leading cryptocurrency, and the US dollar, the global reserve currency. This widely watched pair is crucial for traders and investors seeking to leverage volatility and capitalize on market movements. Monitoring BTCUSD helps gauge cryptocurrency sentiment and understand broader market dynamics.


    BTC/USD Market Overview
    BTC-USD is currently exhibiting signs of weakening bullish momentum amid recent economic data releases from the United States. Traders remain cautious due to the mixed data surrounding the US balance of payments and upcoming speeches from key Federal Reserve officials, including Jerome Powell. Markets are particularly attentive to hints of future monetary policy decisions, especially given the hawkish rhetoric often associated with Fed Chair Powell’s statements. Additionally, the manufacturing and services Purchasing Managers' Index (PMI) reports indicate moderate economic activity, potentially bolstering the US dollar’s strength. Over the next few days, BTC/USD may experience further volatility influenced by these macroeconomic factors, prompting traders to closely monitor related news events.


    BTC/USD Technical Analysis
    Analyzing the daily BTC-USD chart, the recent price action suggests potential bearish signals. The pair established a new higher high around the $124,500 level but subsequently formed a lower low, failing to surpass previous highs—a clear indication of weakening bullish momentum. This is further confirmed by the recent bearish divergence (RD-) appearing at higher peaks. Currently, BTC/USD is trading near critical support around $112,600, which could provide temporary stability. Bollinger Bands narrowing suggests reduced volatility and potential sideways movement, while the %R indicator at -50 reflects neutral market sentiment. Additionally, the Stoch RSI indicator sits at 44.7 and 67.2, indicating neither overbought nor oversold conditions, thus further reinforcing expectations of consolidation.


    Final words about BTC vs USD
    Considering the current technical setup and global economic signals, BTC/USD appears poised for potential consolidation or further weakening in the short term. Traders should closely watch the price reaction at critical support levels, particularly around $112,600, and remain attentive to updates from Federal Reserve officials regarding monetary policy, as these could significantly impact the dollar's strength and BTC valuation. Managing risk effectively is paramount due to the inherent volatility of cryptocurrency markets, and traders should remain flexible and responsive to emerging signals and market developments.


    Disclaimer: This BTCUSD analysis, provided by Unitedpips, is for informational purposes only and does not constitute trading advice. Always conduct your own Forex analysis before making any trading decisions.


    09.23.2025

  3. #103
    Member
    Join Date
    Oct 2024
    Posts
    114
    Gold at All-Time High with Bullish Momentum


    Introduction to XAUUSD
    The XAU/USD pair, often referred to as "gold" represents the exchange rate between gold, the world’s most enduring safe-haven asset, and the US dollar, the global reserve currency. This key trading pair is closely followed by investors and traders who seek stability during times of economic uncertainty or want to capitalize on fluctuations in precious metal prices. Monitoring XAUUSD provides insights into risk sentiment, inflation expectations, and global macroeconomic trends.


    Gold Market Overview
    XAU/USD has surged to a new all-time high, supported by expectations of Federal Reserve rate cuts, safe-haven demand amid ongoing geopolitical tensions, and steady central bank buying, while a softer U.S. dollar has added to gold’s strength. However, the rally faces potential headwinds as upcoming U.S. economic data — including PCE inflation, PMI reports, and new home sales — alongside speeches from key officials such as Fed Chair Jerome Powell and President Trump, could revive dollar demand and temper momentum. In the near term, traders should brace for heightened volatility, with gold’s trajectory hinging on whether U.S. data and policy signals reinforce the dovish outlook or trigger a corrective pullback.


    Gold/USD Technical Analysis
    On the daily chart, XAU/USD has recently broken above a key resistance zone around the $3,700 level, now acting as potential support. The ZigZag (5,10) pattern shows a clear series of higher highs and higher lows, confirming a strong bullish trend that gained momentum in early September. After consolidating within a tight range below $3,700, price surged past this level, indicating a potential continuation of the upward movement. Current price action hovers near $3,763. With the Volatility Close-to-Close rising to 14.28%, market activity has picked up, suggesting increased interest and potential for larger price swings. A sustained hold above $3,700 could open the door toward $3,800 and beyond. However, failure to hold this breakout zone may result in a retest of lower support around $3,660. Overall, momentum remains in favor of the bulls, but traders should be cautious of potential pullbacks in such high-volatility conditions.


    Final words about Gold vs Dollar
    In summary, the XAU/USD pair continues to reflect a bullish outlook driven by macroeconomic dynamics, technical strength, and heightened market volatility. Gold’s recent breakout above the $3,700 mark underscores strong investor confidence, supported by dovish Fed expectations and geopolitical uncertainty. While the broader trend remains upward, the potential for short-term corrections cannot be ignored, especially with key U.S. economic indicators and policy commentary on the horizon. Traders should remain vigilant, balancing the prevailing bullish momentum with the possibility of sharp price swings as the market digests incoming data. Ultimately, gold’s direction will be shaped by how convincingly it can maintain support above $3,700 amid evolving global and monetary developments.


    Disclaimer: This XAUUSD analysis, provided by Unitedpips, is for informational purposes only and does not constitute trading advice. Always conduct your own Forex analysis before making any trading decisions.


    09.24.2025

  4. #104
    Member
    Join Date
    Oct 2024
    Posts
    114
    USD/CHF Daily Analysis: Trend, Support, and Targets


    Introduction to USD/CHF
    The US Dollar vs Swiss Franc pair (USD/CHF) measures the exchange rate between the United States dollar and the Swiss franc — a key safe-haven currency. Often watched by macro traders, USD/CHF is sensitive to interest-rate differentials, central bank guidance, and global risk sentiment. Because the Swiss franc is considered a defensive currency, USD/CHF moves frequently reflect shifts in risk appetite and updates from the Federal Reserve and Swiss National Bank. This makes USD/CHF essential for forex traders tracking monetary policy, safe-haven flows, and cross-market correlations.


    USDCHF Market Overview
    On the Daily (D1) chart USD CHF remains dominated by a broad bearish trend that has accelerated since the pair rolled over from its earlier range high. In the past 48 hours price action shows continued downside momentum with sellers probing near-term support and the pair trading below the moving-average channel — a clear technical sign of bearish control. The macro calendar is crowded with Fed speakers (including Austan Goolsbee, John Williams and other FOMC members) whose more hawkish-leaning comments tend to support the US Dollar; any unexpectedly hawkish tone would likely lift USD relative to the Swiss franc. Conversely, the Swiss National Bank’s policy statements and rate guidance remain the key medium-term driver for CHF strength; SNB communications are scheduled quarterly and will be watched for any hawkish surprises that could tighten CHF support. Expect elevated volatility around Fed commentary and US data releases (GDP, initial jobless claims, durable goods) over the next 24–72 hours — traders should monitor the economic calendar and speaker schedule for USD/CHF trading signals.


    USD-CHF Technical Analysis
    Price action remains bearish on the daily chart, with candles repeatedly consolidating sideways after each down leg and trading below the moving-average channel (acting as resistance). Key downside targets are the Fibonacci cluster around the 0.618 level (~0.7794) and the 0.786 level (~0.7694). Momentum tools show a short-term easing (Accelerator Oscillator green ~0.00236) but no confirmed reversal, while the Chaikin Oscillator (~27.669K) signals muted accumulation — overall favoring sell-the-rallies. A decisive close above the descending trendline and the 0.810–0.815 zone would be required to flip the bias; otherwise the path of least resistance stays down toward the 0.618 area.


    Final words about USD vs CHF
    USD/CHF remains a macro-sensitive currency pair where central bank communication and risk sentiment dominate price action. With the pair below the moving-average channel and pressured by a descending trendline, the technical bias is bearish and traders should prioritize short setups, measured moves, and Fibonacci targets (notably the 0.618 retracement). Keep a close eye on upcoming Fed speeches and US economic releases — any hawkish surprises could temporarily support the US Dollar and trigger corrective bounces in USD/CHF. Conversely, hawkish SNB commentary or unexpected CHF buying interest would accelerate declines. Risk management is critical: use clear stop levels above the moving averages/resistance and scale position sizes if trading around high-impact events. For daily USD/CHF analysis and forex trading signals, combine economic calendar events with technical confirmations (trendline breaks, MA crossovers, and oscillator divergences) before acting.


    Disclaimer: This USDCHF analysis, provided by Unitedpips, is for informational purposes only and does not constitute trading advice. Always conduct your own Forex analysis before making any trading decisions.


    09.25.2025

  5. #105
    Member
    Join Date
    Oct 2024
    Posts
    114
    Daily EUR/GBP Outlook: Ascending Channel Guides Pair Higher


    Introduction to EURGBP
    EUR/GBP, commonly referred to as the "Chunnel," represents the exchange rate between the Euro and the British Pound Sterling. This pair is particularly significant as it reflects economic conditions across the Eurozone and the UK, heavily influenced by monetary policy decisions from both the European Central Bank (ECB) and the Bank of England (BOE). Traders frequently use EUR/GBP as a benchmark for European economic sentiment and stability.


    EUR-GBP Market Overview
    Currently, EUR GBP is exhibiting bullish momentum, driven by recent economic news and market sentiment. GBP recently reacted to economic releases from the Bank of England, including the Money Supply, Mortgage Approvals, and Consumer Credit data. Stronger-than-forecasted data in these reports usually bolster GBP strength by indicating a healthy economic outlook and potentially higher interest rates. Meanwhile, the Euro's strength hinges on the upcoming CPI report and insights from Deutsche Bundesbank President Joachim Nagel, expected to influence future ECB policy direction. Market sentiment remains cautiously optimistic about the Euro, as inflationary pressures in the Eurozone suggest potential tightening from the ECB, boosting EUR's attractiveness.


    EUR/GBP Technical Analysis
    Technical indicators on the daily chart suggest EURGBP is trending upwards within a well-defined ascending channel. Currently, the pair struggles near the midpoint of this channel, moving sideways within a rectangle-shaped consolidation zone. Price action indicates potential retracement to the bottom boundary of the rectangle, yet a continuation of the bullish trend toward the upper channel line is more likely. The Parabolic SAR indicator remains below current price levels, highlighting bullish sentiment. Additionally, the MACD indicator confirms bullish momentum, displaying bullish crossover and positive histogram bars, supporting further upward movement.


    Final Words about EUR vs GBP
    Overall, the EUR GBP pair appears positioned for sustained bullish momentum in the short term, supported by technical patterns and positive Eurozone inflation expectations. Traders should remain vigilant for potential market-moving comments from ECB and BOE officials and carefully monitor upcoming inflation and economic data releases. Key support and resistance levels within the ascending channel provide critical reference points for managing trade entries and exits. It is crucial to adopt a cautious yet opportunistic approach, given the sensitivity of this pair to shifts in monetary policy outlook.


    Disclaimer: This EURGBP analysis, provided by Unitedpips, is for informational purposes only and does not constitute trading advice. Always conduct your own Forex analysis before making any trading decisions.


    09.29.2025

  6. #106
    Member
    Join Date
    Oct 2024
    Posts
    114
    AUD/USD Technical Outlook: Channel Support in Focus


    Introduction to AUDUSD
    The AUD-USD pair, also known as the “Aussie,” represents the exchange rate between the Australian dollar and the US dollar. It is one of the most actively traded currency pairs in the forex market due to its high liquidity and close ties to global commodity prices. Traders often follow AUD/USD closely since the Australian economy is highly influenced by exports such as iron ore and coal, while the US dollar reflects broader global risk sentiment. Monitoring the Aussie against the greenback provides valuable insights into both commodity-driven growth and global monetary policy trends.


    AUD/USD Market Overview
    The AUD USD pair is currently trading within an established bullish channel but showing signs of correction after testing upper resistance levels. The Reserve Bank of Australia (RBA) recently maintained its monetary policy stance, while the market is now looking ahead to the next interest rate decision and statement scheduled for November 4, 2025. Traders will closely watch the RBA’s guidance on inflation and growth, as any hawkish tilt could support the Aussie further. On the US side, Federal Reserve officials, including Raphael Bostic and Susan Collins, are set to deliver speeches that may provide insights into the Fed’s future policy direction, potentially adding volatility to the US dollar. Meanwhile, upcoming releases such as the US House Price Index (Oct 28) and Chicago PMI (Oct 31) could impact dollar strength. In the short term, mixed signals from global economic data suggest that AUD/USD may remain range-bound, with traders eyeing the mid-channel support for cues.


    AUD USD Technical Analysis
    On the daily chart, AUD/USD has been respecting a clear bullish ascending channel, with price currently correcting lower after failing to sustain above resistance levels. Fibonacci extension levels suggest possible upside targets near 0.6650 (0.618) and 0.6739 (0.786) if bullish momentum resumes. However, if bearish pressure continues, the lower boundary of the channel near 0.6530 could act as the next support level. The Accelerator Oscillator (AO) shows a histogram at -0.00248, suggesting weak but improving momentum. Meanwhile, the Chaikin Oscillator is hovering around -17.657K, indicating lingering selling pressure. Overall, while the long-term trend remains bullish within the channel, short-term weakness may persist unless AUD/USD reclaims higher Fibonacci zones.


    Final Words about AUD vs USD
    The AUD/USD pair continues to trade within its bullish structure despite short-term pullbacks. Traders should closely monitor the channel support near 0.6530, as a break below could open the door for deeper corrections. On the upside, reclaiming 0.6650 would strengthen bullish momentum and signal another push towards 0.6739 resistance. The RBA’s upcoming monetary policy decisions and US Federal Reserve commentary will remain key drivers for volatility in the pair. Overall, the Aussie remains resilient, but cautious positioning is recommended given global uncertainty.


    Disclaimer: This AUDUSD analysis, provided by Unitedpips, is for informational purposes only and does not constitute trading advice. Always conduct your own Forex analysis before making any trading decisions.


    09.30.2025

  7. #107
    Member
    Join Date
    Oct 2024
    Posts
    114
    Can Silver Break Its $50 All-Time High Against USD?


    Introduction to XAG/USD
    The Silver / US Dollar (XAG/USD) pair, often referred to as the "poor man’s gold," is a popular asset in the commodities market due to its dual role as both a precious metal and an industrial input. Silver tends to track gold’s movements but with higher volatility, making it attractive for traders seeking strong price swings. The XAG-USD exchange rate reflects the value of one ounce of silver priced in US dollars and is widely followed by investors for both inflation hedging and industrial demand outlook. Understanding silver’s price movements against the dollar provides crucial insights for commodities traders and long-term investors alike.


    XAGUSD Market Overview
    The XAGUSD pair is trading strongly bullish, with current prices around $47.20 per ounce, placing silver close to its all-time high of $49.21 - $49.51 per ounce last reached in April 2011. This rally has been supported by growing investor demand amid concerns of persistent inflation and uncertainty in US economic data. This week, traders are awaiting important US economic releases including the Dallas Fed speech from President Lorie Logan (Oct 2, 2025), which may provide hints on future Federal Reserve monetary policy. Employment data from ADP (Nov 5, 2025) and manufacturing PMI releases (Nov 3, 2025) are also on the radar, as stronger-than-expected results would likely strengthen the US dollar and weigh on silver’s momentum. In the short term, however, silver’s rally is being fueled by commodity investors positioning ahead of inflation reports and continued volatility in the energy markets. Overall, silver remains highly sensitive to US dollar dynamics and Federal Reserve commentary this week.


    XAG-USD Technical Analysis
    On the daily timeframe (D1), silver is showing strong bullish momentum. Price action has formed higher highs and higher lows, supported by the ZigZag indicator, which confirms the current uptrend. The Alligator indicator is aligned in bullish formation, with the green lips on top, red teeth in the middle, and blue jaw below – all placed beneath the candles, signaling continued upward momentum. The Aroon indicator highlights trend strength, with the Aroon Up line at 92.86% and the Aroon Down line at 7.14%, confirming that bulls are firmly in control. Additionally, the VI (Vortex Indicator) shows the VI+ at 1.3829 versus VI- at 0.6308, further reinforcing the dominance of buyers. Key resistance stands near the historical high at $49.79, while immediate support is seen around $43.60 and then $38.90 if a pullback occurs.


    Final Words about XAG vs USD
    The XAG/USD pair is currently approaching critical historical resistance levels, with silver prices nearing their 2011 all-time highs. Technical indicators across the daily chart are aligned in favor of the bulls, with trend momentum strongly positive. However, traders should be cautious, as the closer silver gets to $50 per ounce, the higher the chances of profit-taking and sharp corrections. The upcoming Federal Reserve speeches and US employment data will be key drivers, as stronger USD fundamentals could slow silver’s advance. For now, the bullish bias remains intact, and traders should watch resistance around $49.50 – $49.80 as a decisive breakout zone that could open the door to fresh all-time highs.


    Disclaimer: This XAGUSD analysis, provided by Unitedpips, is for informational purposes only and does not constitute trading advice. Always conduct your own Forex analysis before making any trading decisions.


    10.01.2025

  8. #108
    Member
    Join Date
    Oct 2024
    Posts
    114
    USD/JPY Consolidates Amid Key Economic Announcements


    Introduction to USD/JPY
    The USD JPY pair, popularly known as "The Ninja," represents the value of the US dollar against the Japanese yen. It is among the most actively traded currency pairs worldwide due to Japan's significant role in the global economy and the US dollar’s dominance in international finance. Monitoring USD/JPY provides insights into economic conditions and policies in both the United States and Japan, making it essential for traders and investors.


    USD JPY Market Overview
    Currently, USD-JPY is experiencing moderate volatility, influenced by recent US economic releases and upcoming statements from Federal Reserve officials. Federal Reserve Bank of Chicago President Austan Goolsbee's recent hawkish sentiments could support the US dollar, while traders await further comments from Dallas Fed President Lorie Logan to gauge future policy directions. Additionally, employment figures, jobless claims, and manufacturing order data will heavily impact trader sentiment, potentially providing further strength to the US dollar if outcomes surpass market expectations. In Japan, recent updates from the Bank of Japan and yield rates on Japanese Government Bonds (JGB) are closely watched. While BOJ policy remains steady, shifts in JGB auction results and consumer confidence figures will likely affect yen stability over the coming days.


    USDJPY Technical Analysis
    From a technical perspective, USD/JPY shows bullish long-term momentum, repeatedly testing and rebounding from its support line. However, recent price action indicates a loss of bullish strength, leading to sideways consolidation. The current candle is positioned below the mid-line of the price channel, indicating short-term bearish pressure. Aroon indicator currently shows the upper line at 71.43%, suggesting stronger bullish momentum compared to the bearish lower line at 28.57%. Meanwhile, the Fisher Transform is currently bearish, with a fisher line reading of -0.21 and a trigger line at 0.41, hinting at potential near-term bearishness or consolidation.


    Final Words about USD vs JPY
    In conclusion, the USD/JPY pair shows a cautiously bullish outlook tempered by recent technical and fundamental developments. Traders should closely monitor support levels for potential retests and breakouts. Upcoming economic releases from both the US and Japan will be pivotal, especially speeches from Federal Reserve officials and employment data. It's advisable for traders to exercise risk management strategies, as unexpected policy announcements or economic data can rapidly alter market sentiment and price action for USD/JPY.


    Disclaimer: This USDJPY analysis, provided by Unitedpips, is for informational purposes only and does not constitute trading advice. Always conduct your own Forex analysis before making any trading decisions.


    10.02.2025

  9. #109
    Member
    Join Date
    Oct 2024
    Posts
    114
    GBPUSD Daily: Fed Speeches Increase Volatility


    Introduction to GBP/USD
    The GBP/USD currency pair, universally known by its historical nickname "The Cable," is a major in the global Forex market, pitting the British Pound Sterling against the US Dollar. This highly liquid pair serves as a key barometer of both UK and US economic health, financial stability, and respective central bank monetary policy outlooks. Its price action is closely watched for insights into global risk sentiment, with movements often characterized by significant market volatility.


    GBP-USD Market Overview
    The GBP-USD pair is currently navigating a period of heightened volatility as traders square positions ahead of key central bank commentary, influencing the immediate US Dollar strength or weakness. The overall global trend has been dictated by a tug-of-war between a structurally cooling US labor market, suggesting future Fed dovishness, and persistent inflation pressures in the UK service sector. Today's focus is squarely on the barrage of speeches from influential FOMC members, including NY Fed President John Williams, Dallas Fed President Lorie Logan, and Governor Philip Jefferson. Should these officials strike a hawkish tone, the US Dollar could find renewed strength, capping The Cable's recent uptrend. Looking ahead to next week, all eyes will be on BOE Governor Andrew Bailey's speech on October 6th for fresh clues on the Bank of England's stance on macro-financial stability, which could ignite the next leg of a Bullish Momentum if he sounds confident or unexpectedly hawkish. Pre-positioning for the high-impact Non-Farm Payrolls (NFP) data, due in November, is also subtly driving market sentiment, making the GBP/USD Daily Analysis heavily reliant on these forward-looking fundamental catalysts.


    GBP/USD Technical Analysis
    On the Daily (D1) chart, the GBP/USD price currently sits at $1.34444, reflecting a delicate balance as it ranges between a long-term bullish and bearish trend lines. Despite this overarching consolidation, the pair has exhibited a clear, though corrected, recent bullish trend since finding a temporary floor. Key technical levels to watch are the immediate Support and Resistance zones: initial support is found around 1.34200, while the first formidable resistance target is set at 1.35600. Indicator analysis supports a fragile upward tilt; the Alligator indicator's lines (Jaw, Teeth, and Lips) are moving very closely together, which reinforces the current state of range-bound consolidation as momentum gathers. Crucially, the Fisher Transform is indicating a shift towards a potential Forex Trading Signal for a buy, with the Fisher line at -0.89 crossing above the Trigger line at -1.18, suggesting that bullish momentum is attempting to take control and could drive the price toward a breakout of the 1.35600 barrier.


    Final words about GBP vs USD
    The immediate outlook for the GBP USD pair is one of elevated caution and high market volatility, directly tied to today's heavy slate of FOMC Speeches. Given the Fisher Transform's tentative buy signal and the current proximity to support at 1.34200, there is a short-term bias for the bulls to test the 1.35600 resistance level. However, traders must remain highly vigilant, as any coordinated hawkish remarks from the Fed could swiftly re-assert US Dollar strength, triggering a retreat back toward the lower end of the daily range. The key determinant for a sustained breakout will be the market's perception of the Monetary Policy Outlook for both the Fed and the BOE, especially as the market prices in the upcoming BOE Governor Bailey speech and anticipates the November NFP report. Prudent Forex Trading strategy necessitates setting tight stop-losses and awaiting a confirmed break above 1.35600 for a long entry, or a decisive break below 1.34200 for a bearish pivot.


    Disclaimer: This GBPUSD analysis, provided by Unitedpips, is for informational purposes only and does not constitute trading advice. Always conduct your own Forex analysis before making any trading decisions.


    10.03.2025

  10. #110
    Member
    Join Date
    Oct 2024
    Posts
    114
    EUR/GBP Daily Analysis: Euro Maintains Bullish Momentum


    Introduction to EURGBP
    The EURGBP pair, often referred to as the “Chunnel” due to the Channel Tunnel linking the Eurozone and the United Kingdom, measures the exchange rate between the Euro and the British Pound Sterling. This currency pair is one of the most actively traded in the forex market, offering insights into the relative strength of two major European economies. The pair is popular among traders for its typically low volatility and strong reaction to European Central Bank (ECB) and Bank of England (BOE) policy announcements. Monitoring EUR-GBP price movements helps traders understand broader trends in European monetary policy and economic sentiment.


    EUR/GBP Market Overview
    The EUR/GBP pair is currently showing moderate bullish pressure as the Euro gains slight strength against the Pound Sterling. Investor focus this week is on upcoming European Central Bank (ECB) President Christine Lagarde’s testimony before the Committee on Economic and Monetary Affairs in Strasbourg on October 7, 2025, which may provide hints about future interest rate decisions. Recent Sentix Investor Confidence data showed improving sentiment in the Eurozone, suggesting optimism about the region’s economic outlook. Meanwhile, Eurostat’s Retail Sales report indicated stable consumer spending levels, reflecting moderate economic resilience across Europe. On the UK side, the S&P Global Construction PMI continues to signal moderate expansion, holding above the 50.0 mark, suggesting strength in Britain’s construction sector. Additionally, traders are closely watching Bank of England Governor Andrew Bailey’s speech at Scotland’s Global Investment Summit in Edinburgh, as his remarks may hint at potential tightening or rate hold decisions. Overall, the market mood favors the Euro slightly, supported by improving investor sentiment and the anticipation of steady ECB guidance.


    EUR-GBP Technical Analysis
    The EUR GBP daily chart shows a continuation of a bullish trend that started in early 2025. The ZigZag indicator confirms this upward momentum, with its latest line moving upward and currently positioned at 0.87502, while the current market price is 0.87182, suggesting a minor pullback within a broader uptrend. The Alligator indicator displays a classic bullish alignment, with the Lips (green) above the Teeth (red) and Jaw (blue); all trending upward, confirming ongoing buying strength. The Aroon indicator shows the Aroon Up at 57.14% and Aroon Down at 0.00%, indicating that the uptrend remains dominant, though with room for consolidation. Meanwhile, the Vortex Indicator (VI) shows VI+ at 1.1715 and VI– at 0.8524, reinforcing bullish control over the pair’s direction. Strong resistance is seen at 0.8748, which has been tested multiple times without a breakout, while immediate support lies around 0.87000. A decisive close above the 0.87500 level could open the door for further bullish continuation toward 0.88000, whereas a break below 0.87000 could signal short-term weakness.


    Final Words About EUR vs GBP
    In conclusion, the EUR/GBP pair is maintaining a bullish structure on the daily timeframe, supported by technical indicators and improving Eurozone sentiment. Traders should closely monitor upcoming speeches from ECB President Christine Lagarde and BOE Governor Andrew Bailey for potential policy cues that could impact short-term volatility. As long as the price stays above the 0.87000 support region, the outlook remains favorable for Euro buyers targeting the 0.8750–0.8800 resistance zone. However, traders should remain cautious of sudden pullbacks driven by shifts in UK economic data or unexpected central bank commentary. The current setup suggests a cautiously bullish bias for the Euro against the Pound Sterling in the near term.


    Disclaimer: This EURGBP analysis, provided by Unitedpips, is for informational purposes only and does not constitute trading advice. Always conduct your own Forex analysis before making any trading decisions.


    10.06.2025

Page 11 of 12 FirstFirst ... 9 10 11 12 LastLast

Bookmarks

Posting Permissions

  • You may not post new threads
  • You may not post replies
  • You may not post attachments
  • You may not edit your posts
  •