Page 10 of 11 FirstFirst ... 8 9 10 11 LastLast
Results 91 to 100 of 104
Like Tree2Likes

Daily Market Analysis and Overview by Unitedpips

This is a discussion on Daily Market Analysis and Overview by Unitedpips within the Analytics and News forums, part of the Trading Forum category; AUD/USD Market Overview: Key Risks and Opportunities Introduction to AUD-USD The AUD/USD currency pair, commonly known as the "Aussie," represents ...


  1. #91
    Member
    Join Date
    Oct 2024
    Posts
    104
    AUD/USD Market Overview: Key Risks and Opportunities


    Introduction to AUD-USD
    The AUD/USD currency pair, commonly known as the "Aussie," represents the exchange rate between the Australian dollar and the US dollar, making it one of the most widely traded pairs in the forex market. It is closely followed by traders due to its strong correlation with global commodity prices, particularly gold and iron ore, which are major Australian exports. Movements in this pair are often influenced by economic data from Australia and the United States, as well as shifts in global risk appetite. The "Aussie" is favored by traders for its tendency to reflect broader market sentiment and its sensitivity to interest rate differentials between the two economies.


    AUD/USD Market Overview
    Currently, AUD/USD is trading with cautious sentiment as markets weigh upcoming economic releases from both the US and Australia. On the US side, traders are closely watching weekly crude oil inventory reports from the American Petroleum Institute (API) and the Energy Information Administration (EIA), which can influence the dollar through shifts in energy prices and overall risk sentiment. Additionally, remarks from Richmond Fed President Thomas Barkin, particularly if hawkish, could reinforce USD strength by hinting at tighter monetary policy. In Australia, focus turns to the Melbourne Institute’s Leading Index due mid-September, followed by the Consumer Price Index (CPI) later in the month, a key inflation gauge that could impact expectations for future Reserve Bank of Australia decisions. Looking further ahead, Construction Work Done data in November will provide additional insights into Australia’s growth outlook. Together, these events set the stage for potential volatility in the "Aussie," with traders balancing US policy signals against Australian inflation and growth indicators.


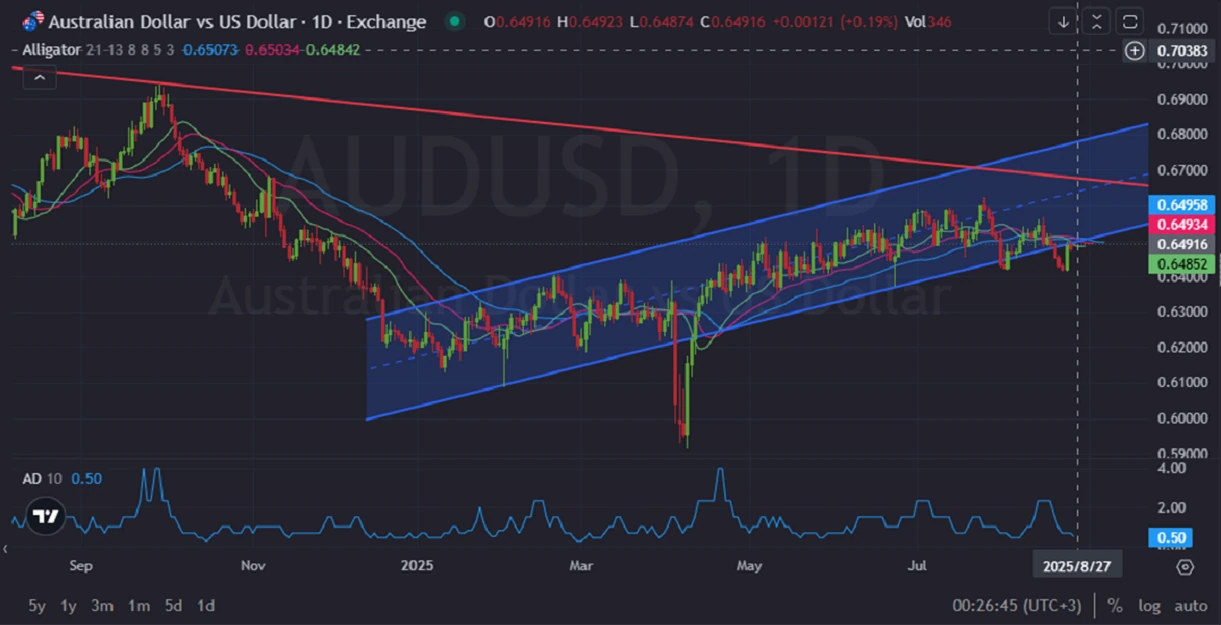
    AUDUSD Technical Analysis
    From a technical standpoint, AUD/USD has been trading within an upward channel since early 2025, though recent price action shows weakness as the pair tests the lower boundary of the channel. The Alligator indicator lines are currently converging, reflecting indecision and the potential for sideways movement in the short term. Immediate support is seen near 0.6485, a level that coincides with the channel floor, while resistance lies around 0.6650–0.6700, aligning with the channel’s upper boundary and the descending long-term trendline. A sustained break below 0.6485 could signal further downside pressure, while a rebound from this level would keep the broader upward bias intact. Traders should remain cautious as the pair consolidates, with upcoming fundamental catalysts likely to dictate the next directional move.


    Final words about AUD vs USD
    In conclusion, the AUD/USD remains at a critical juncture, caught between key technical levels and a series of important economic events from both Australia and the US. While the broader uptrend channel provides a supportive structure, the pair’s current consolidation highlights growing uncertainty. Traders will be watching closely for signals from upcoming inflation data, construction figures, and Federal Reserve commentary to determine the next decisive move. Whether the "Aussie" holds its ground above support or breaks lower will largely depend on the balance between commodity-driven Australian strength and the evolving outlook for US monetary policy.


    Disclaimer: This AUDUSD analysis, provided by Unitedpips, is for informational purposes only and does not constitute trading advice. Always conduct your own Forex analysis before making any trading decisions.


    08.27.2025

  2. #92
    Member
    Join Date
    Oct 2024
    Posts
    104
    EUR vs JPY: Navigating Sideways Market Movements


    Introduction to EURJPY
    The EUR-JPY pair, often known as the "Euppy," represents the exchange rate between the Eurozone's euro and the Japanese yen. It is favored by traders who appreciate its volatility and liquidity, often making it suitable for carry trade strategies. Understanding EUR/JPY movements offers insights into economic health comparisons between the European and Japanese economies, significantly impacting trading strategies.


    EUR/JPY Market Overview
    EURJPY has been experiencing mixed signals as it currently consolidates after a significant bullish move. Recent European economic news from S&P Global indicated mixed Purchasing Managers' Index (PMI) readings, with numbers above 50 indicating industry expansion, supporting the Euro's short-term stability. On the Japanese side, the latest release from the Ministry of Finance revealed data on new capital expenditures, suggesting cautious optimism in Japan’s economic activities. Meanwhile, the Jibun Bank Manufacturing PMI showed similar economic trends, influencing trader sentiment. Traders should closely monitor these economic indicators in the upcoming days, as any divergence could sharply affect the EUR/JPY exchange rate.


    EUR/JPY Technical Analysis
    The EUR JPY pair is currently exhibiting a classic sideways triangle formation, signaling a potential breakout. Price action shows strong support from the Alligator indicator's teeth line, although it faces immediate resistance at the lips line, indicating a tight struggle between buyers and sellers. Additionally, the Awesome Oscillator currently stands at -0.2, suggesting mildly bearish momentum. Connors RSI, at 76.4, points to a slightly overbought scenario, hinting at possible short-term reversals. Traders should pay attention to these indicators, focusing especially on potential breakout levels from the triangular consolidation pattern.


    Final Words about EUR vs JPY
    The EUR/JPY pair is currently in a decisive phase, characterized by consolidation that suggests imminent volatility. Given the present technical indicators, traders should remain vigilant for potential breakouts, closely monitoring PMI and capital expenditure data from both the Eurozone and Japan. Any unexpected economic news could serve as a catalyst for a significant price movement. Risk management remains essential, as volatile market conditions may quickly shift trader sentiment. Continuous monitoring of technical levels and economic indicators will provide valuable insights into future price direction.


    Disclaimer: This EURJPY analysis, provided by Unitedpips, is for informational purposes only and does not constitute trading advice. Always conduct your own Forex analysis before making any trading decisions.


    09.01.2025

  3. #93
    Member
    Join Date
    Oct 2024
    Posts
    104
    Spot Gold Technical Forecast: Indicators Confirm Strong Upward Momentum


    Introduction to XAU/USD
    The XAUUSD pair, commonly referred to as "Spot Gold," represents the exchange rate between gold and the US dollar, making it a critical indicator for commodity and currency traders worldwide. Gold, known as a safe-haven asset, often moves inversely to the USD, highlighting its importance during economic uncertainty. Tracking XAU/USD movements provides essential insights into market sentiments, inflation expectations, and global economic health.


    XAUUSD Market Overview
    XAU/USD is currently exhibiting a bullish trend, breaking through the upper band of its recent triangular price formation. Recent economic releases from the US indicate positive momentum for the US dollar, with manufacturing data from the Institute for Supply Management (ISM) suggesting industry expansion, supported by robust purchasing managers' indexes. Additionally, the Manufacturing Prices Paid index signals potential inflationary pressures that typically benefit gold as a hedge against inflation. However, positive economic sentiments from consumer confidence surveys indicate a mixed outlook that might restrain significant USD depreciation. Traders are closely watching the upcoming economic reports due in early October for further direction.


    XAU-USD Technical Analysis
    Technical indicators and price actions point towards continued bullish momentum for XAUUSD. The daily candlestick chart shows a clear breakout above the triangular pattern's upper resistance, forecasting an extended upward movement toward the resistance level of approximately 3893.54. Currently, the price candles are positioned above the channel’s middle band, reinforcing the bullish trend. The Williams %R indicator at -0.10 suggests the asset is currently overbought, signaling strong bullish sentiment in the market. Additionally, the Accelerator Oscillator displays a positive momentum with a green histogram at level 33.54, further confirming bullish bias.


    Final Words about XAU vs USD
    Given the technical breakout and supportive indicators, XAU/USD appears poised to sustain its bullish trajectory in the near term. Traders should monitor key resistance at 3893.54 for confirmation of continued bullish strength or potential pullbacks towards the support level at 3315.44. Economic data releases from the US will be crucial to watch, as strong USD fundamentals could momentarily cap gold’s gains. However, the broader outlook for Gold remains positive, particularly if inflationary pressures persist, enhancing its appeal as a protective asset.


    Disclaimer: This XAUUSD analysis, provided by Unitedpips, is for informational purposes only and does not constitute trading advice. Always conduct your own Forex analysis before making any trading decisions.


    09.02.2025

  4. #94
    Member
    Join Date
    Oct 2024
    Posts
    104
    GBP/USD Forex Forecast: Will Cable Hold the Trendline?


    Introduction to GBP/USD
    The GBP/USD currency pair, often referred to as “Cable,” measures the value of the British pound against the US dollar. It is one of the most traded forex pairs worldwide and is closely followed due to its liquidity and volatility. Traders watch GBP/USD to gain insights into the economic relationship between the United Kingdom and the United States. Understanding this pair helps forex traders make informed decisions based on both technical indicators and macroeconomic news.


    GBPUSD Market Overview
    The GBPUSD pair is currently under pressure as global market sentiment reacts to central bank updates from both the Federal Reserve and the Bank of England. On the US side, investors are awaiting remarks from Federal Reserve Bank of St. Louis President Alberto Musalem at the Peterson Institute for International Economics, which could provide hints about future monetary policy direction. Additionally, upcoming data releases such as the JOLTS job openings report, Factory Orders, and US auto sales are likely to create short-term volatility for the US dollar. Meanwhile, in the UK, markets are paying close attention to Bank of England Deputy Governor Sarah Breeden’s speech at the BOE Innovation in Money and Payments Conference, which may reveal fresh insights into monetary policy. Furthermore, the UK Services PMI data due later this week will be a crucial indicator of economic strength. Overall, the tug-of-war between hawkish Fed expectations and cautious BOE signals is shaping the near-term outlook for the GBP USD pair.


    GBP-USD Technical Analysis
    On the daily chart, GBP-USD is testing a critical support area. The Price Channel indicator shows the lower band moving upward while the upper band remains horizontal, suggesting that buyers are trying to defend the uptrend despite recent bearish candles. The last two daily candles are red, pressing against the mid-line of the Price Channel and approaching the support zone, which aligns with the long-term bullish trendline. This support level is crucial, as a break below could trigger further downside momentum. On the resistance side, sellers are positioned around the upper Price Channel level and the mid-term descending trendline. The Aroon indicator signals strong bearish pressure, with the orange (up) line at 0% and the blue (down) line at 92.86%. Similarly, the Vortex Indicator shows bearish dominance as VI- (red) is at 1.1818, crossing sharply above VI+ (blue) at 0.8629. These technical signals suggest that bearish sentiment is strengthening, but the key support zone will determine whether GBP USD holds or breaks lower.


    Final Words about GBP vs USD
    The GBP/USD pair is at a decisive stage, with both technical and fundamental factors playing critical roles in shaping its next move. If the pair manages to hold above the strong support zone, it could rebound toward resistance levels near 1.3600. However, failure to defend this zone may trigger a bearish extension toward 1.3050 or even lower in the medium term. Traders should closely monitor central bank speeches, US labor data, and UK PMI releases for direction cues. Risk management remains crucial, as volatility around these events can spark sudden price swings. In summary, GBP/USD traders should remain cautious but alert, as the pair is consolidating ahead of potentially significant market-moving news.


    Disclaimer: This GBPUSD analysis, provided by Unitedpips, is for informational purposes only and does not constitute trading advice. Always conduct your own Forex analysis before making any trading decisions.


    09.03.2025

  5. #95
    Member
    Join Date
    Oct 2024
    Posts
    104
    USD/CHF Currency Pair: Bearish Trend Set to Persist


    Introduction to USDCHF
    The USD-CHF currency pair, often known as the "Swissie," measures the exchange rate between the US dollar and the Swiss franc. This pair is favored by traders seeking stability, given the Swiss franc's status as a safe-haven currency. Movements in USD/CHF often reflect broader economic sentiment, risk appetite, and financial market stability.


    USD/CHF Market Overview
    Currently, the USDCHF is influenced by recent economic data releases from the United States, primarily employment and productivity statistics. The ADP Employment Change and Jobless Claims reports indicate mixed labor market conditions, showing employment growth but persistent job cuts. Furthermore, productivity figures from the Bureau of Labor Statistics showed a decline, suggesting rising labor costs which could influence future monetary policy decisions by the Federal Reserve. Swiss economic data remains relatively stable, with upcoming CPI and unemployment data expected to provide additional market direction. Investors remain cautious, awaiting further clarity from Federal Reserve commentary, particularly from New York Fed President John Williams, regarding future interest rate trajectories.


    USD-CHF Technical Analysis
    Analyzing the daily chart, USD/CHF is exhibiting bearish sentiment, moving downward slowly following a recent consolidation phase. The current price action is testing resistance around the 0.80379 level. Given the bearish momentum, prices may correct upward towards the previous high at 0.81492 before potentially continuing downward. On the downside, a strong support level lies at approximately 0.79106. The Williams Alligator indicator suggests a bearish bias, with all lines positioned slightly above the current price, arranged sequentially from jaw to teeth to lips. Meanwhile, the Awesome Oscillator remains bearish at -0.00239, signaling selling pressure, and the Aroon indicator highlights continued bearish strength with its lower line at 78.57%, indicating dominant bearish momentum.


    Final Words about USD vs CHF
    Considering the prevailing technical indicators and current economic data from both the US and Switzerland, USD/CHF may experience temporary upward corrections before continuing its overall bearish trend. Traders should closely monitor key resistance and support levels for potential breakout signals. Ongoing economic data from the US, particularly labor market reports and Fed commentary, could significantly influence short-term volatility. Caution is advised, with attention to both technical signals and upcoming economic releases to manage risk effectively in this environment.


    Disclaimer: This USDCHF analysis, provided by Unitedpips, is for informational purposes only and does not constitute trading advice. Always conduct your own Forex analysis before making any trading decisions.


    09.04.2025

  6. #96
    Member
    Join Date
    Oct 2024
    Posts
    104
    Silver Price Forecast: Technical Correction in Sight for XAG/USD


    Introduction to XAG/USD
    The XAGUSD pair represents the exchange rate between Silver, commonly known as "the white metal," and the US dollar. This pairing is highly significant for commodity traders and investors who closely monitor precious metals as safe-haven assets. Silver’s price fluctuations reflect both market sentiment and economic health, especially during uncertain economic times.


    XAG-USD Market Overview
    Silver (XAG/USD) currently demonstrates a bullish sentiment, moving within an ascending channel, influenced significantly by recent economic news from the United States. Traders are closely observing the remarks by Austan Goolsbee, President of the Federal Reserve Bank of Chicago, during his participation in mHUB’s Industry Disruptor Series. His statements, if leaning hawkish, could boost USD strength and pressure Silver prices downward. Additionally, critical US labor market data, including Non-Farm Payrolls (NFP), Employment Cost Index, and Unemployment Rate, is expected to provide further volatility in the pair. A stronger-than-forecast labor market generally supports the US dollar, potentially curbing the recent bullish run on Silver. Traders should remain alert to these developments as they will likely set the tone for Silver’s near-term price action.


    XAGUSD Technical Analysis
    Analyzing the daily chart for XAG-USD, the price is clearly trading within an ascending channel and has recently encountered resistance near the channel's midline, prompting a corrective move downward. Given the recent bearish (red) candle formation and the significant gap between current prices and the EMA (60), further corrective movement towards the lower boundary of the channel seems plausible. Parabolic SAR indicators, currently below the price, are signaling bullishness but indicate slowing momentum as the dots spread wider apart. RSI (14) is registering at approximately 68, indicating near-overbought conditions and supporting the idea of an imminent correction. The Fisher indicator is currently at 2.6 and 2.9, highlighting potential upcoming volatility as these levels suggest possible price reversals.


    Final words about XAG vs USD
    Considering both technical and fundamental analyses, XAG/USD is poised for a short-term correction before potentially resuming its bullish trajectory within the ascending channel. Traders should pay close attention to key economic indicators and central bank commentary, which could significantly influence market sentiment and volatility. Risk management strategies remain crucial due to the inherent volatility of precious metals trading. Continuously tracking technical indicators and market news will be essential for informed decision-making.


    Disclaimer: This XAGUSD analysis, provided by Unitedpips, is for informational purposes only and does not constitute trading advice. Always conduct your own Forex analysis before making any trading decisions.


    09.05.2025

  7. #97
    Member
    Join Date
    Oct 2024
    Posts
    104
    Key Factors Driving USD/CHF Movements


    Introduction to USD/CHF
    The USD/CHF currency pair, often referred to as the "Swissie," represents the exchange rate between the US dollar and the Swiss franc. Known for its status as a safe-haven asset, the Swiss franc tends to attract investors during times of global uncertainty, making USD/CHF a key barometer of risk sentiment in the forex market. Switzerland’s strong financial sector, political stability, and history of low inflation enhance the franc’s appeal, while movements in USD/CHF are also influenced by US Federal Reserve policy and broader dollar trends. This pair is closely watched by traders as it reflects the balance between global risk appetite and safe-haven demand.


    USDCHF Market Overview
    The USD-CHF pair shows mixed momentum as traders weigh upcoming U.S. economic releases against Swiss central bank guidance. In the U.S., focus is on the Producer Price Index (PPI) and Core PPI from the Bureau of Labor Statistics on October 16, 2025, as early signals of consumer price pressures that may influence the Federal Reserve. Weekly crude oil and inventory data from the EIA and API on September 17, 2025, could add short-term volatility, while the U.S. 10-year Treasury auction on October 8 and wholesale inventories on October 9 will be watched for investor confidence and business spending trends. In Switzerland, SNB Chairman Martin Schlegel’s speech at the Ticino Bankers’ Association may trigger volatility as markets seek hawkish or dovish cues. Overall, USD/CHF is likely to remain highly sensitive to both U.S. inflation and Swiss monetary policy in the coming weeks.


    USD-CHF Technical Analysis
    On the daily chart, USD/CHF remains under sustained bearish pressure, continuing its broader downtrend from earlier this year. The pair has been consolidating between 0.8018 and 0.8043, but the latest breakdown signals weakening momentum. The long-term trendline from the monthly chart acts as resistance, reinforcing the bearish outlook. Technical indicators confirm this: Parabolic SAR dots are above price, Williams Alligator lines remain in a bearish alignment, and the Aroon shows a strong downtrend (Aroon Down 92.86%, Aroon Up 14.29%). Traders should watch for declines toward 0.7900, while a break above 0.8040–0.8060 is needed to challenge the bearish bias.


    Final Words on USD vs CHF
    USD/CHF sits at a crossroads where technical and fundamental factors could shape its direction. Technically, failure to break above 0.8040–0.8060 and bearish indicator alignment keep momentum to the downside, consistent with the broader 2025 trend. Fundamentally, U.S. data—especially mid-October PPI releases—along with weekly energy inventories, Treasury auctions, and wholesale updates could trigger dollar volatility. Meanwhile, SNB Chairman Schlegel’s remarks may influence Swiss policy expectations. Traders should expect USD/CHF to remain highly reactive and prone to sharp moves.


    Disclaimer: This USDCHF analysis, provided by Unitedpips, is for informational purposes only and does not constitute trading advice. Always conduct your own Forex analysis before making any trading decisions.


    09.10.2025

  8. #98
    Member
    Join Date
    Oct 2024
    Posts
    104
    EUR/GBP Technical Insights: Channel Support Holds the Key


    Introduction to EURGBP
    The EUR-GBP pair, often called "Chunnel," represents the exchange rate between the Euro and the British Pound Sterling, two of the most influential currencies in global finance. Traders frequently monitor this pair due to its significance in reflecting economic health within the European Union and the United Kingdom. The pair's movements are strongly influenced by economic data, political events, and central bank policies. Mastering the EUR/GBP dynamics is essential for making informed investment decisions.


    EUR/GBP Market Overview
    EURGBP is currently experiencing upward pressure, driven by recent European economic releases and market sentiment. Recent data from Destatis and INSEE revealed favorable CPI figures, suggesting sustained inflationary pressures that could bolster the Euro. Additionally, upcoming speeches by key ECB members like Deutsche Bundesbank President Joachim Nagel are closely watched, as hawkish signals typically strengthen the Euro further. Conversely, recent economic indicators from the UK, including GDP, industrial and manufacturing production, and trade balance figures released by the Office for National Statistics, will provide essential insights into the Pound's strength. Traders should remain vigilant for the upcoming UK economic data on October 16, 2025, as these reports will likely induce volatility in the EUR/GBP exchange rate.


    EUR-GBP Technical Analysis
    Technical indicators suggest a bullish outlook for EURGBP, which currently trades along the bottom line of an ascending channel. Should the support at the channel’s lower boundary hold firm, prices could rebound toward the channel's midpoint and subsequently its upper limit. Failure to maintain this support level could lead prices to decline towards a critical support area around 0.86100. The Moving Average Convergence Divergence (MACD) indicator remains bullish, signaling potential upward momentum continuation. Additionally, the Directional Movement Index (DMI) shows buyers gaining strength, reinforcing the probability of a bullish reversal at the current support.


    Final Words on EUR vs GBP
    Considering both fundamental and technical perspectives, EUR/GBP appears poised for potential upside movement, contingent on sustained support at current technical levels. Traders should closely monitor incoming economic data and central bank communications for further directional cues. Given the inherently volatile nature of currency markets, risk management strategies remain crucial. Adapting swiftly to new economic indicators and central bank signals will be vital for capitalizing on upcoming trading opportunities within the EUR/GBP market.


    Disclaimer: This EURGBP analysis, provided by Unitedpips, is for informational purposes only and does not constitute trading advice. Always conduct your own Forex analysis before making any trading decisions.


    09.12.2025

  9. #99
    Member
    Join Date
    Oct 2024
    Posts
    104
    Euro vs Swiss Franc Technical Outlook: Critical Levels to Watch


    Introduction to EUR/CHF
    The EURCHF currency pair, often referred to as the "Euro-Swissie," represents the exchange rate between the Euro and the Swiss Franc. This pairing is closely monitored due to its significance in reflecting economic health and stability within Europe and Switzerland. Traders often use EUR/CHF as an indicator of market sentiment, particularly during periods of risk aversion. Understanding this pair's behavior helps traders and investors make informed decisions on currency movements within European markets.


    EUR-CHF Market Overview
    EUR CHF is currently maintaining a bearish trend amidst recent economic reports from Europe and Switzerland. The Producer Price Index (PPI) and Wholesale Price Index (WPI) reports, due for release on October 10 and October 15 respectively, will be critical in determining the Euro's strength, as higher-than-expected results typically support currency appreciation. Additionally, upcoming trade balance reports from Eurostat and Istat on October 16 could add volatility, given their direct implication on export and import dynamics. Furthermore, ECB President Christine Lagarde's upcoming speech on September 17 could influence market sentiment significantly, especially if her remarks are perceived as hawkish. Traders should closely monitor these events as they will provide substantial clues regarding the near-term trajectory of the EUR/CHF pair.


    EUR/CHF Technical Analysis
    On the daily chart, EUR CHF is trading below its critical 200-day moving average (~0.939), affirming the bearish momentum. The technical dashboard shows a clear Sell signal, with the Relative Strength Index (RSI) around 45, indicating moderate bearish sentiment without yet reaching oversold conditions. The Awesome Oscillator registers at approximately -0.00201, reinforcing the ongoing bearish market structure. Unless the price decisively closes above the 200-day moving average, bearish continuation appears more probable. Notably, established support zones indicated on the chart, around 0.9300-0.9200, serve as potential downside targets.


    Final Words about EUR vs CHF
    Considering current technical indicators and upcoming economic data, the EUR/CHF pair is likely to maintain its downward trajectory in the short term. Traders should remain cautious, observing the critical 200-day moving average as a decisive pivot level for potential reversals. Economic announcements such as the Eurozone's PPI, WPI, and trade balance reports will significantly impact this pair, hence careful monitoring is essential. Additionally, Christine Lagarde's comments could induce volatility, emphasizing the importance of risk management strategies during this period.


    Disclaimer: This EURCHF analysis, provided by Unitedpips, is for informational purposes only and does not constitute trading advice. Always conduct your own Forex analysis before making any trading decisions.


    09.15.2025

  10. #100
    Member
    Join Date
    Oct 2024
    Posts
    104
    GBP/USD Price Action: Bullish Momentum Meets Key Fibonacci Levels


    Introduction to GBP/USD
    The GBP/USD pair, also known as “Cable”, represents the exchange rate between the British Pound Sterling (GBP) and the United States Dollar (USD). It is one of the most actively traded currency pairs in the forex market, favored by traders due to its liquidity and volatility. The nickname "Cable" originates from the mid-19th century when the first transatlantic cable transmitted GBP/USD quotes between London and New York. Monitoring this pair provides valuable insight into the economic health of both the United Kingdom and the United States, as well as the broader global economy.


    GBPUSD Market Overview
    The GBP USD pair is currently trading around 1.3619 after testing higher levels earlier in the week. Recent US data releases continue to influence the greenback, with the latest Initial Jobless Claims report signaling labor market resilience ahead of the September 25, 2025 release. Traders are also focusing on the Philadelphia Fed Manufacturing Index, due in October, which could offer fresh signals on business sentiment. On the UK side, attention remains fixed on the Bank of England (BOE) and its Monetary Policy Committee (MPC) stance, with the next rate decision scheduled for November 6, 2025. Until then, speculation around rate hikes or policy shifts continues to drive Sterling volatility. Broader global sentiment has also impacted the pair, with commodity prices and risk appetite affecting short-term positioning in GBP/USD.


    GBP-USD Technical Analysis
    From a daily chart perspective (D1), GBP USD has been moving in a bullish trend but recently entered a correction phase. The price action shows that candles have broken above the 0.236 Fibonacci extension level (1.3572) and are currently targeting the next significant resistance near the 0.382 Fibonacci level (1.3803). However, if bullish momentum fades, the pair could retrace towards the key support at 1.3199, which marks a previous swing low. The Williams Alligator indicator shows alignment with the lips, teeth, and jaw structure pointing to a continuation of the uptrend, while the Aroon indicator signals strong bullish dominance with the upper line at 92.86% compared to the lower line at 21.43%. Meanwhile, the Awesome Oscillator (AO) is hovering near 0.00128, indicating a neutral to slightly bullish momentum but also cautioning traders of possible consolidation.


    Final Words about GBP vs USD
    Overall, the GBP/USD pair remains in a cautiously bullish structure, with price action supported by recent technical breakouts. Traders should watch closely how the pair reacts to the 1.3800 Fibonacci resistance zone, as a clear break above could confirm a stronger bullish continuation. On the downside, failure to maintain current momentum may lead to a pullback toward the 1.3200 support area, which aligns with previous market structure. Upcoming US labor market data, coupled with BOE policy expectations, will play a decisive role in setting the next directional bias. In conclusion, GBP/USD traders should remain alert for both macroeconomic developments and technical signals to optimize their trading strategies.


    Disclaimer: This GBPUSD analysis, provided by Unitedpips, is for informational purposes only and does not constitute trading advice. Always conduct your own Forex analysis before making any trading decisions.


    09.18.2025

Page 10 of 11 FirstFirst ... 8 9 10 11 LastLast

Bookmarks

Posting Permissions

  • You may not post new threads
  • You may not post replies
  • You may not post attachments
  • You may not edit your posts
  •