GOLDUSD Daily Technical and Fundamental Analysis
Introduction to GOLDUSD
GOLD, often referred to as "the yellow metal," is traded in the forex market as GOLDUSD or XAUUSD. Renowned for its role as a safe-haven asset, gold attracts investor interest during times of economic uncertainty. This precious metal is closely linked to macroeconomic indicators and global risk sentiment, offering traders a unique blend of stability and speculative opportunities. Monitoring GOLDUSD is essential for understanding the interplay between economic data, central bank policies, and market sentiment.
Gold Market Overview
GOLDUSD is in the spotlight today as traders await critical U.S. economic data, including the New York Manufacturing Index and PMI releases for both manufacturing and services. Strong U.S. data could bolster the US Dollar, applying downward pressure on gold prices as the opportunity cost of holding non-yielding assets like gold increases. Conversely, weaker-than-expected figures may provide a tailwind for gold, as investors typically pivot to safe-haven assets in times of economic slowdown. This interplay between USD strength and gold's safe-haven appeal underscores the significance of today's data releases for XAUUSD traders.
GOLD/USD Technical Analysis
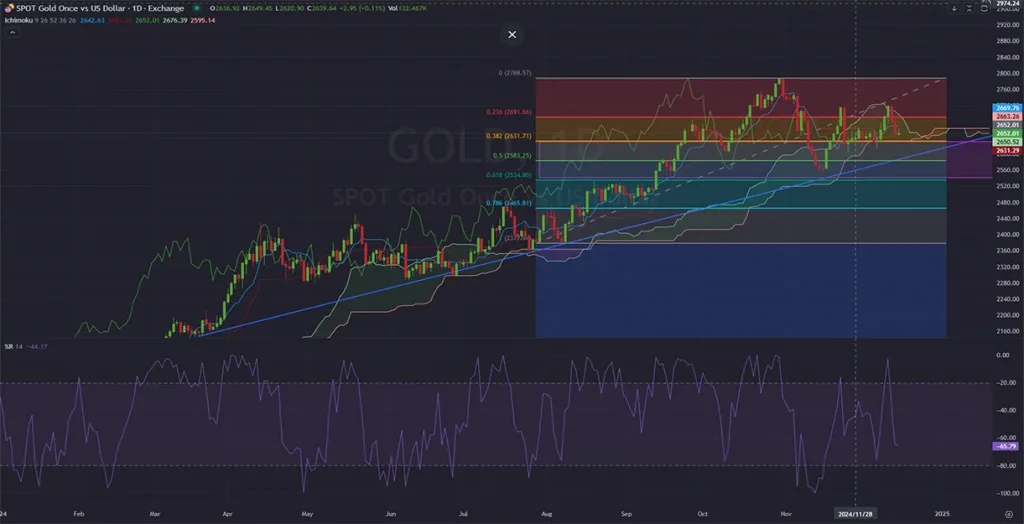
On the daily chart, GOLDUSD is exhibiting clear bearish momentum, marked by a sequence of consecutive red candles before last week's market close. As the new week began, the price briefly tested the upper boundary of the Ichimoku cloud, signaling a loss of bullish strength. Subsequently, GOLDUSD broke below the 0.382 Fibonacci retracement level at $2,654.55, which now serves as an immediate resistance point. The next downside target lies at the 0.5 Fibonacci level near $2,632.17, presenting a potential area for price stabilization.
The Williams %R indicator currently registers at -96.16, indicating deeply oversold conditions. This suggests the possibility of a short-term bounce; however, it does not negate the prevailing bearish momentum. Immediate support is firmly located at $2,632.17, aligning with the 0.382 Fibonacci retracement, while resistance looms near $2,677.72 at the upper edge of the Ichimoku cloud. If sellers maintain control, the next critical support level at $2,609.79 could come into play, reinforcing the bearish outlook unless significant buying pressure emerges to alter the trajectory.
Final Words About GOLD vs USD
GOLDUSD remains a focal point for traders amid upcoming U.S. economic data, which could heavily influence short-term price action. With bearish technical signals dominating the daily chart, the pair faces significant resistance levels that could limit upside recovery. However, oversold conditions on the Williams %R indicate that a near-term rebound is plausible, creating a dynamic environment for traders. As global economic conditions evolve and today’s PMI data unfold, traders should maintain vigilance around key support and resistance levels. Employing disciplined risk management will be critical as GOLDUSD navigates heightened market volatility.
12.17.2024


 LinkBack URL
 About LinkBacks


 Reply With Quote


Bookmarks