
 1Likes
 LinkBack URL
 About LinkBacks


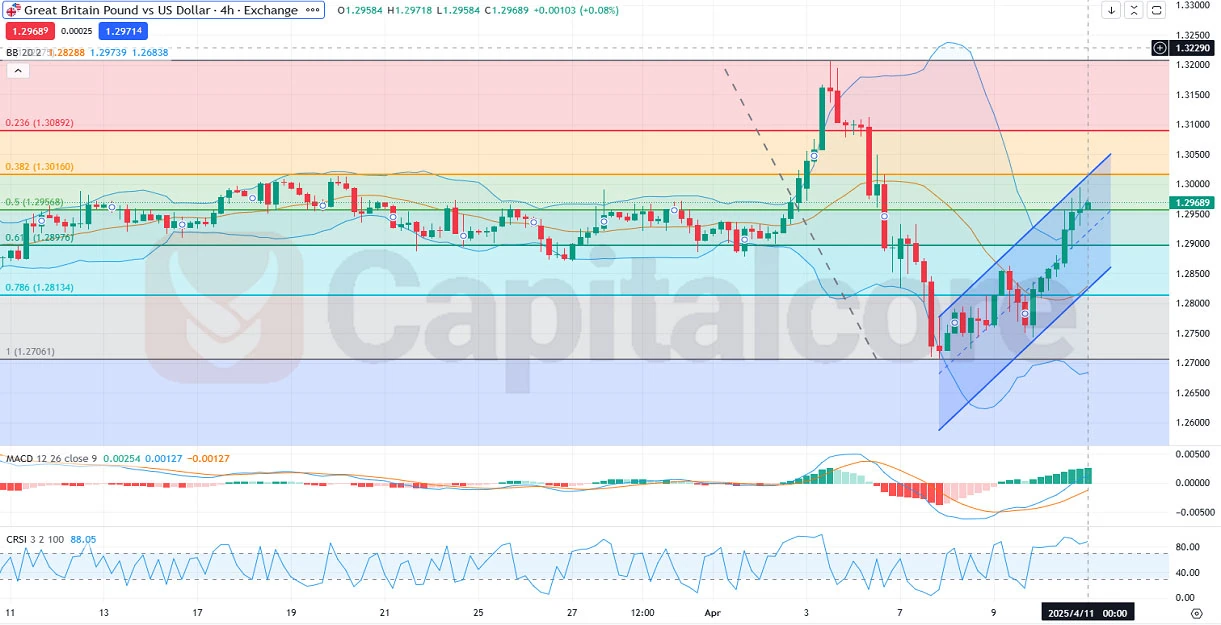
GBPUSD daily chart analysis and key resistance zones
The GBPUSD forex pair, commonly referred to by its nickname "Cable," represents the exchange rate between the British Pound Sterling and the US Dollar. It is one of the most liquid and widely traded currency pairs in the forex market, driven by key macroeconomic indicators and central bank policies from both the United Kingdom and the United States. On April 11, 2025, the GBPUSD is positioned ahead of several impactful fundamental events. For the USD, speeches from influential FOMC members such as John Williams and Alberto Musalem are expected to influence market sentiment, especially if the tone is more hawkish, hinting at future interest rate hikes. Additionally, the release of the University of Michigan Consumer Sentiment and Inflation Expectations, along with the PPI and Core PPI, will offer insight into inflationary trends and consumer outlookkey considerations for future Fed decisions. On the UK side, a slate of economic data including monthly GDP, manufacturing production, trade balance, and construction output is set to be released. These will provide a broader view of the UK economys performance. A stronger-than-expected showing could support further gains for the pound, especially if the US data signals slowing inflation or dovish undertones from Fed officials.
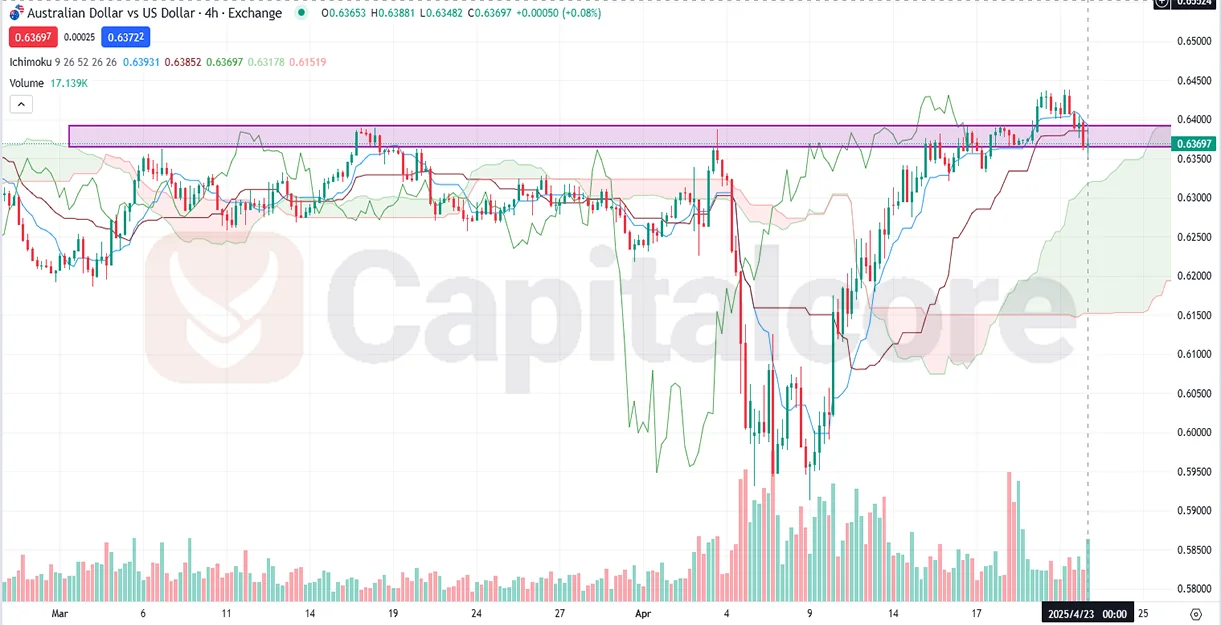
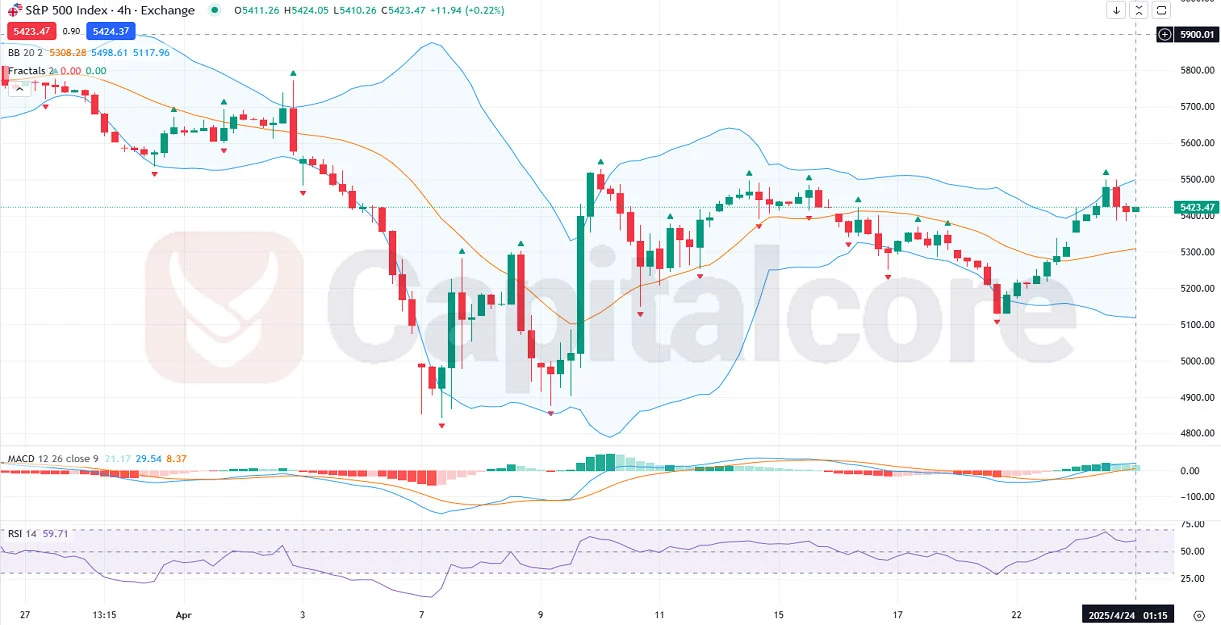
Chart Notes:
Chart time-zone is UTC (+03:00)
Candles time-frame is 4h.
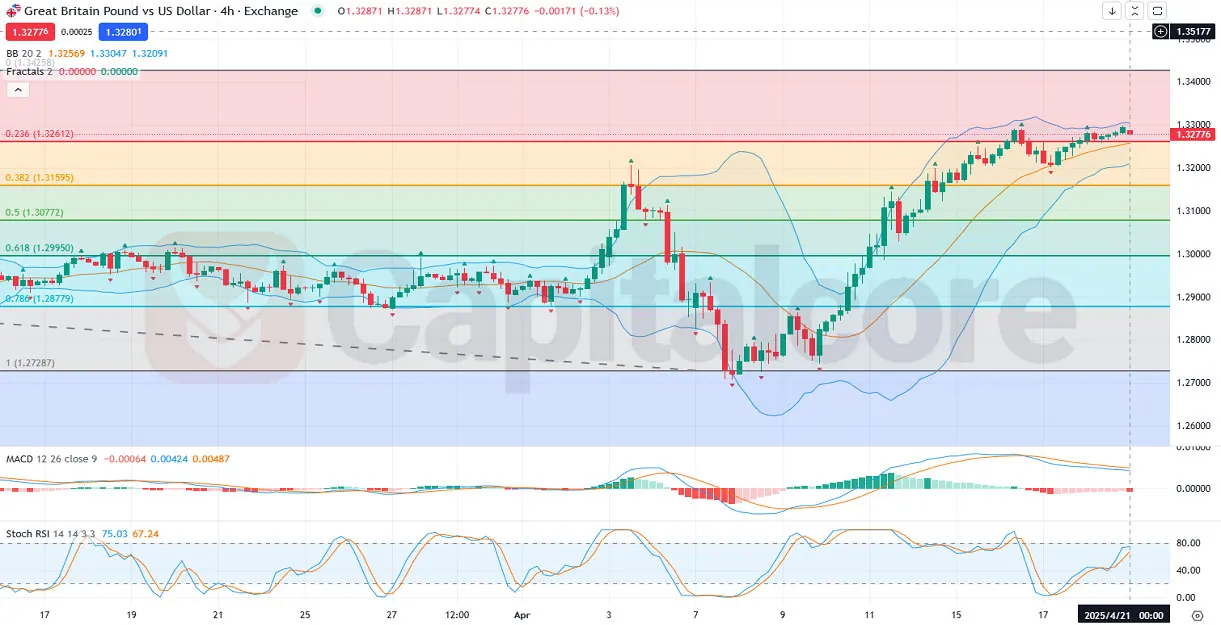
Technically, the GBPUSD H4 chart shows strong bullish price action within a well-defined ascending channel. The last eight candlesticks have been consecutively bullish, pushing the price above the 1.29500 level and testing the 0.5 Fibonacci retracement level. With the current candle opening at this level, a successful breakout could target the 0.382 Fibonacci level near 1.30160. The Bollinger Bands indicate upward momentum, with the GBPUSD price hugging the upper banda classic signal of bullish strength. The MACD shows growing bullish momentum, as both the MACD line and histogram rise above the signal line. Additionally, the Connors RSI (CRSI) is above 88, signaling strong buying pressure but also approaching potential overbought conditions. Overall, the technical outlook remains bullish in the short term, with 1.30160 and potentially 1.30890 as the next key resistance levels if fundamentals align.
DISCLAIMER: Please note that the above analysis is not an investment suggestion by Capitalcore LLC. This post has been published only for educational purposes.
Capitalcore


 Reply With Quote


Bookmarks