Page 16 of 16 FirstFirst ... 6 14 15 16
Results 151 to 157 of 157
Like Tree1Likes

Daily Market Forecast By Capitalcore

This is a discussion on Daily Market Forecast By Capitalcore within the Analytics and News forums, part of the Trading Forum category; USD30 DowJones Price Action Outlook USD30-DowJones, commonly known as “the Dow,” is a prime gauge of U.S. economic health and ...


  1. #151
    Junior Member Capitalcore's Avatar
    Join Date
    May 2024
    Posts
    157
    USD30 DowJones Price Action Outlook

    USD30-DowJones, commonly known as “the Dow,” is a prime gauge of U.S. economic health and a favorite for daily chart technical and fundamental analysis. Today’s upcoming events, including Wards Auto data, Construction Spending figures, ISM Manufacturing surveys, S&P Global PMI, and a Federal Reserve speech, could significantly influence price action by reflecting consumer confidence, inflation pressures, and potential monetary policy shifts.


    Chart Notes:
    • Chart time-zone is UTC (+02:00)
    • Candles’ time-frame is 4h.

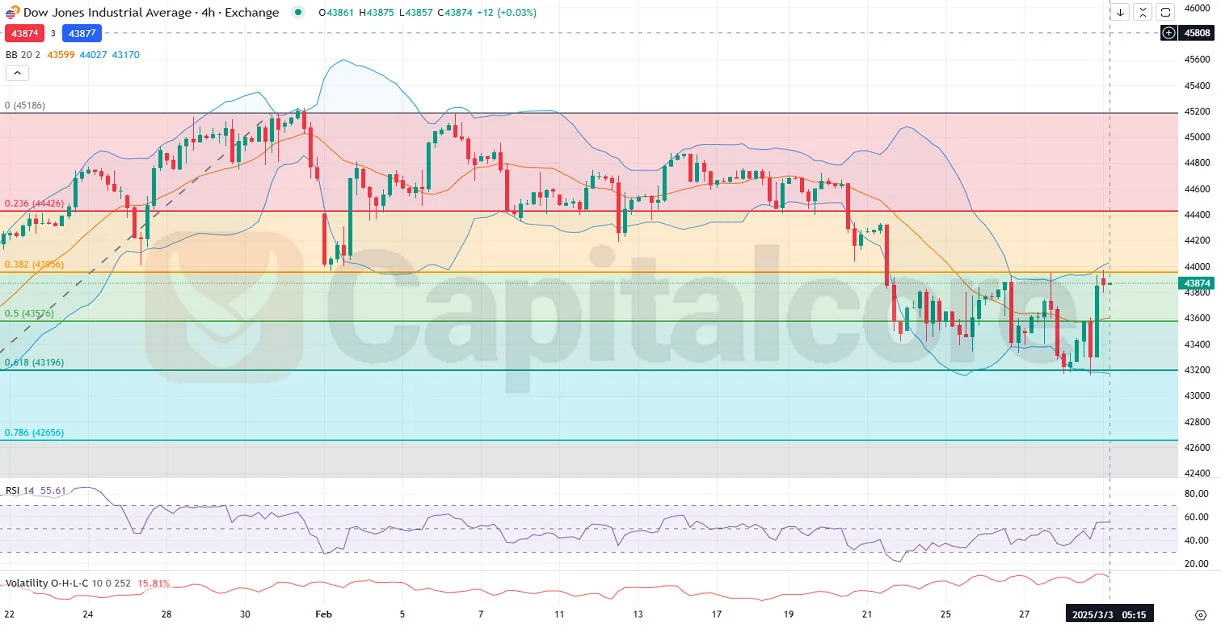
    In the USD30-DowJones H4 chart, Bollinger Bands indicate that after a bearish trend, the index rebounded sharply off the lower band and pushed past the middle band. The RSI points to renewed buying momentum, while volatility and O.H.L.C. data suggest possible price swings in the near term. Currently, the price is near the 0.382 Fibonacci level and appears confined between the 0.618 and 0.382 levels, signaling that a decisive breakout or continued consolidation could shape the next phase of price action. Traders should watch for sustained closes above the middle band to confirm further upside potential. Conversely, a failure to hold above this mid-level could lead to another pullback, testing lower support areas and challenging bullish momentum.

    • DISCLAIMER: Please note that the above analysis is not an investment suggestion by “Capitalcore LLC”. This post has been published only for educational purposes.

    Capitalcore

  2. #152
    Junior Member Capitalcore's Avatar
    Join Date
    May 2024
    Posts
    157
    GOLD Targets New ATH Amid Increased Volatility

    XAUUSD, also known as GOLD or GOLDUSD in forex markets, is among the most traded commodity-based currency pairs. Nicknamed the "safe haven asset," Gold typically attracts investors during periods of economic uncertainty. Today, the upcoming USD news releases; including Job Cut Announcements, Initial Jobless Claims, Nonfarm Productivity, Unit Labor Costs, Trade Balance, Wholesale Inventories, and Natural Gas Storage; could induce volatility in USD pairs, including XAUUSD. Positive employment data or hawkish comments from FOMC member Patrick Harker might strengthen the USD, potentially putting downward pressure on GOLD. Conversely, weaker-than-expected figures would likely enhance Gold’s appeal, boosting its price upward due to its inverse relationship with USD strength.

    Chart Notes:
    • Chart time-zone is UTC (+02:00)
    • Candles’ time-frame is 4h.

    Analyzing the H4 chart for XAUUSD, the price action clearly indicates a fresh bullish momentum, pushing towards previous all-time highs (ATH). The recent ATH has been consistently surpassed, signaling robust bullish sentiment. Currently, the Gold price movements are within expanded Bollinger Bands, illustrating heightened volatility. Price is encountering resistance at the Fibonacci retracement level of 0.786 (around 2927.57). However, given the bullish momentum, GOLDUSD has potential to surpass this level, targeting the 1.0 Fibonacci level (approximately 2953.44), potentially establishing a new ATH. The XAUUSD price resides in the upper half of the Bollinger Bands, with the upper band around 2940 acting as an immediate resistance en route to ATH levels. The RSI at 59.78 indicates bullish strength without being overbought, and Volatility OHLC signals increased trading activity, supporting the bullish scenario.

    • DISCLAIMER: Please note that the above analysis is not an investment suggestion by “Capitalcore LLC”. This post has been published only for educational purposes.

    Capitalcore

  3. #153
    Junior Member Capitalcore's Avatar
    Join Date
    May 2024
    Posts
    157
    USDJPY Fundamental and Technical Analysis – H4 Chart Insights

    The USD/JPY currency pair, often referred to as the "Ninja," is a major forex pair that represents the exchange rate between the US Dollar (USD) and the Japanese Yen (JPY). As a highly liquid pair, USDJPY is influenced by macroeconomic data, central bank policies, and market sentiment. Today’s key economic events include the US Consumer Price Index (CPI) report, which serves as a crucial inflation gauge, impacting Federal Reserve interest rate expectations. Higher-than-expected CPI figures will strengthen USD as traders anticipate potential Fed rate hikes, while weaker data could pressure the dollar. Additionally, Japan’s Corporate Goods Price Index (CGPI) data will influence the JPY, but its effect might be limited unless it deviates significantly from forecasts.

    Chart Notes:
    • Chart time-zone is UTC (+02:00)
    • Candles’ time-frame is 4h.

    On the USDJPY H4 chart, the pair recently rebounded from its ascending trendline, coinciding with the 61.8% Fibonacci retracement level, indicating strong technical support. Currently, the price is testing the upper Bollinger Band, facing resistance. If it breaks above this level, the next upside target will be the 148.997 resistance zone, aligning with the 50% Fibonacci retracement. The Parabolic SAR indicator shows the last four dots below the price, signaling bullish momentum. Meanwhile, the Stochastic Oscillator is nearing the overbought zone, suggesting possible short-term exhaustion before another upward push. The Awesome Oscillator (AO) displays growing green bars, indicating strengthening bullish momentum. A sustained break above 148.997 would confirm a trend reversal, while failure to breach the Bollinger Band resistance may result in another pullback toward the support trendline.

    DISCLAIMER: Please note that the above analysis is not an investment suggestion by “Capitalcore LLC”. This post has been published only for educational purposes.

    Capitalcore

  4. #154
    Junior Member Capitalcore's Avatar
    Join Date
    May 2024
    Posts
    157
    US30 Price Action and Forex Fundamental Analysis

    US30, also known as the Dow Jones Industrial Average, is a popular stock market index representing 30 significant publicly traded companies in the U.S. Often called "Dow," it serves as a crucial indicator of the overall health of the U.S. economy. Today’s key economic events include the Core Producer Price Index (PPI), Producer Price Index, Initial Jobless Claims, Natural Gas Storage levels, and the 30-Year Treasury Bond auction results. An increase in PPI figures above forecasts typically supports the USD and can apply bearish pressure to US30 due to prospects of tighter monetary policy. Conversely, lower-than-expected Initial Jobless Claims would reflect economic strength, potentially offsetting bearish sentiments and providing support for the Dow.

    Chart Notes:
    • Chart time-zone is UTC (+02:00)
    • Candles’ time-frame is 4h.

    Analyzing the US30 H4 chart, the price is moving within a clear bearish channel below the Ichimoku cloud, reflecting sustained downward momentum. Price action is consolidating between the Fibonacci retracement levels of 0.618 (41,983) and 0.786 (41,104), indicating strong bearish pressure. MACD continues to exhibit negative momentum with bearish histogram bars, while RSI remains below 30, confirming oversold conditions and highlighting the risk of a corrective rebound or temporary consolidation.

    • DISCLAIMER: Please note that the above analysis is not an investment suggestion by “Capitalcore LLC”. This post has been published only for educational purposes.

    Capitalcore

  5. #155
    Junior Member Capitalcore's Avatar
    Join Date
    May 2024
    Posts
    157
    GOLDUSD Analysis Strong Bullish Trend Above Ichimoku Cloud

    Gold (XAU/USD), also known as the "yellow metal," is a highly sought-after asset in forex trading, often serving as a safe-haven investment during times of economic uncertainty. As one of the most liquid commodities, GOLD price action is closely linked to macroeconomic data, inflation trends, and central bank policies. Today, GOLD/USD’s movement will be influenced by the University of Michigan Consumer Sentiment and Inflation Expectations reports, which are key indicators of economic confidence and future inflation trends. If these reports show stronger-than-expected results, the U.S. dollar (USD) may strengthen, potentially leading to a pullback in GOLD prices. However, if consumer confidence and inflation expectations come in weaker, GOLD could continue its bullish rally, as traders seek safe-haven assets amid economic uncertainty. With inflation concerns still present, GOLD remains a key hedge against currency devaluation, and its price action is expected to react sharply to the data release.

    Chart Notes:
    • Chart time-zone is UTC (+02:00)
    • Candles’ time-frame is 4h.

    The GOLD/USD (XAUUSD) H4 chart shows a strong bullish continuation, with GOLD recently recording a new all-time high (ATH). The price action is characterized by sharp bullish candles moving significantly above the Ichimoku Cloud, indicating strong momentum and an established uptrend. The Ichimoku cloud itself has tightened, but both the upper and lower boundaries are trending upwards, further reinforcing bullish strength. Additionally, momentum indicators confirm the ongoing bullish sentiment. The MACD and its histogram show increasing bullish momentum, with the MACD line widening its gap above the signal line. The RSI has surged above 78, signaling overbought conditions, which could lead to temporary pullbacks or consolidation before another leg higher. Given this price action setup, traders should watch for potential retracements towards key support levels near $2,950 before a continuation of the uptrend. However, a break below the cloud could indicate a shift in momentum.

    • DISCLAIMER: Please note that the above analysis is not an investment suggestion by “Capitalcore LLC”. This post has been published only for educational purposes.

    Capitalcore

  6. #156
    Junior Member Capitalcore's Avatar
    Join Date
    May 2024
    Posts
    157
    EURUSD Technical Analysis for Today's Trading Signals

    EUR USD, known in forex trading as the "Fiber," represents the exchange rate between the Euro and the US Dollar and is one of the most traded currency pairs globally. The Fiber often reflects market sentiment towards the European and U.S. economies. Today's upcoming news includes crucial data releases: U.S. Building Permits, Housing Starts, Import Price Index, Capacity Utilization Rate, and Industrial Production. Positive outcomes in these metrics, particularly Building Permits and Industrial Production, could strengthen the USD, potentially causing downward pressure on EURUSD. On the other side, Eurozone releases including Trade Balance and ZEW Economic Sentiment may impact the Euro positively if outcomes exceed forecasts, promoting upward momentum in EUR-USD. Traders should monitor these indicators closely for price action signals.

    Chart Notes:
    • Chart time-zone is UTC (+02:00)
    • Candles’ time-frame is 4h.

    Analyzing the provided EUR/USD H4 chart reveals that the price has decisively broken through a significant resistance line, indicating strong bullish momentum. However, the price currently faces resistance at the horizontal line and the upper Bollinger Band, suggesting a potential short-term correction or pullback. Technical indicators like the Bollinger Bands hint at possible corrective moves downwards towards the supporting ascending trendline and subsequently to the middle Bollinger Band, providing dynamic support around this zone. Should selling pressure persist, a deeper retracement to the lower Bollinger Band and key support at 1.05194 may occur. Additionally, the Stochastic indicator is entering an overbought territory, signaling a potential bearish reversal or consolidation soon. Concurrently, the MACD histogram shows decreasing bullish momentum, corroborating the possibility of an imminent correction. Traders are advised to observe price action near these technical levels for confirmation.

    • DISCLAIMER: Please note that the above analysis is not an investment suggestion by “Capitalcore LLC”. This post has been published only for educational purposes.

    Capitalcore

  7. #157
    Junior Member Capitalcore's Avatar
    Join Date
    May 2024
    Posts
    157
    AUD/USD Price Action Breakout Analysis

    The AUD USD, known popularly as the "Aussie," is a major forex pair representing the Australian dollar against the US dollar. It is favored by traders for its strong correlation to commodity prices and market sentiment. Today, fundamental factors for AUD-USD include the Melbourne Institute (MI) Westpac Leading Index from Australia, with higher-than-forecast results likely supporting the Australian dollar. On the US side, traders will closely monitor crude oil inventories from the Energy Information Administration (EIA), Fed Interest Rate decisions, the FOMC statement, economic projections, and the Fed Chair's press conference, all of which can heavily influence USD strength. A hawkish stance or reduced crude inventories could boost the USD, creating volatility in the AUD vs USD pair.

    Chart Notes:
    • Chart time-zone is UTC (+02:00)
    • Candles’ time-frame is 4h.

    Analyzing the AUD-USD H4 chart, the price action has clearly broken through the resistance zone at 0.63553 and recently retested this level as support. This pullback indicates a possible continuation upward if the price can sustain above this critical zone. Should the price fail to hold above this newly established support, it could retrace down towards the ascending trendline and further to the key support level at 0.63318. The Stochastic oscillator shows decreasing bullish momentum and is trending downward, indicating potential short-term bearish pressure. Additionally, the MACD indicator suggests bearish sentiment, as it has recently produced a bearish crossover, signaling potential downward price action in the immediate short-term.

    • DISCLAIMER: Please note that the above analysis is not an investment suggestion by “Capitalcore LLC”. This post has been published only for educational purposes.

    Capitalcore

Page 16 of 16 FirstFirst ... 6 14 15 16

Bookmarks

Posting Permissions

  • You may not post new threads
  • You may not post replies
  • You may not post attachments
  • You may not edit your posts
  •