Page 27 of 43 FirstFirst ... 17 25 26 27 28 29 37 ... LastLast
Results 261 to 270 of 430
Like Tree6Likes

Forex Strategies

This is a discussion on Forex Strategies within the Trading Systems forums, part of the Trading Forum category; Talking Points - According to Tony Crabbel, narrow range breakouts lead to resumption of the major trend - Narrow Range ...


  1. #261
    member ForeCastle's Avatar
    Join Date
    Apr 2013
    Posts
    1,077
    Blog Entries
    236

    Trading the GBPUSD Narrow Range Breakout Strategy

    Talking Points
    - According to Tony Crabbel, narrow range breakouts lead to resumption of the major trend
    - Narrow Range breakouts can provide good risk to reward setups that are easy to identify
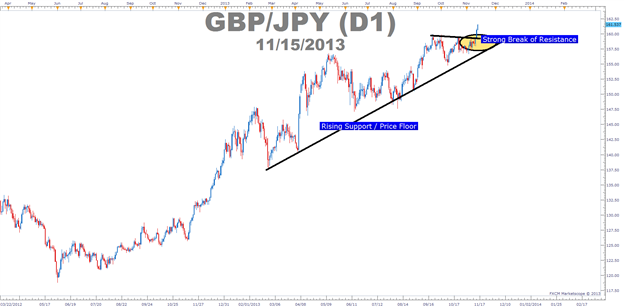
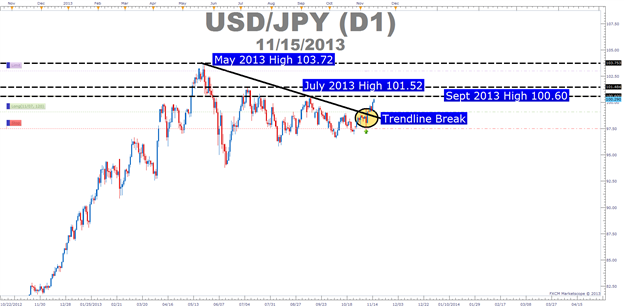
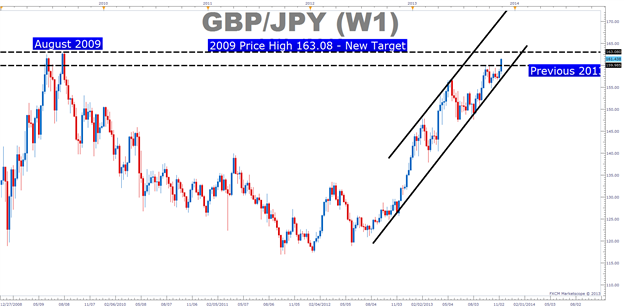
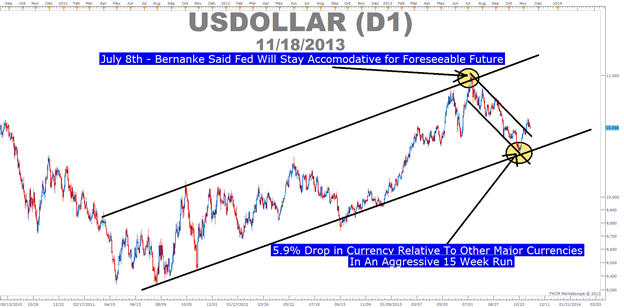
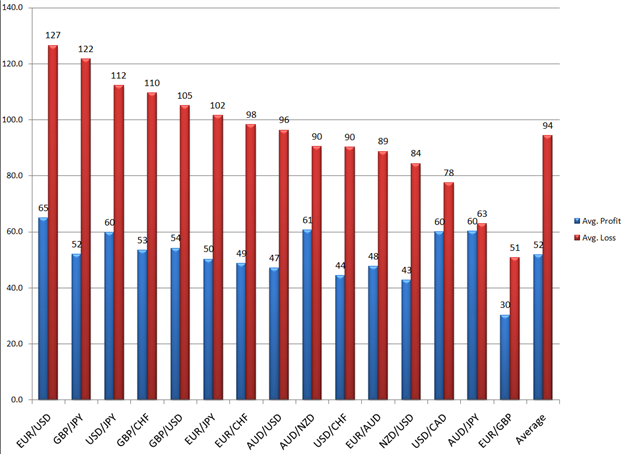
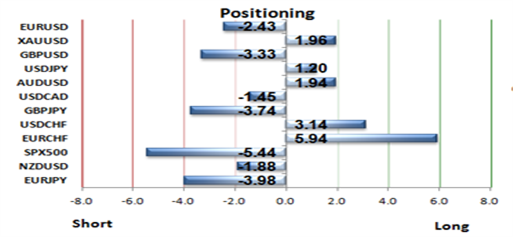
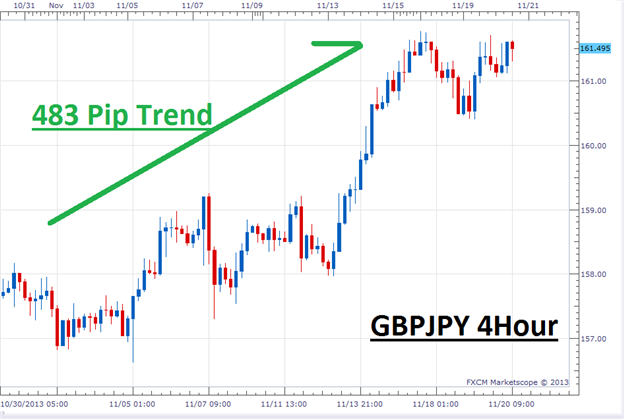
    - GBP has been one of the strongest G-10 currencies and the uptrend is likely to continue

    What is a Narrow Range Breakout?

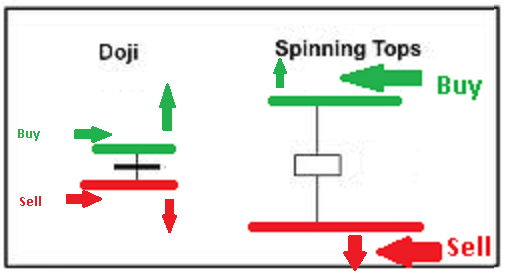
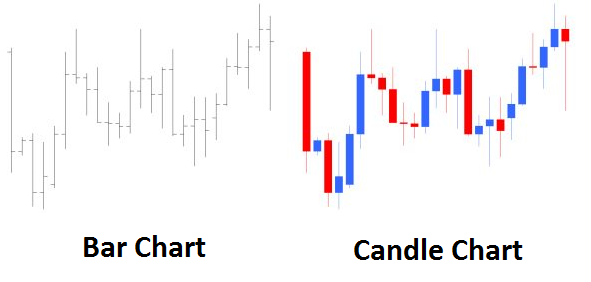
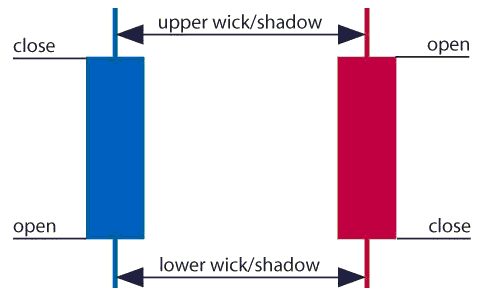
    Tony Crabbel is credited with first writing about Narrow range breakout patterns in his now out-of-print book, “Day Trading with Short Term Price Patterns & Opening Range Breakout” in 1990 some 12 years before Mark Fisher’s Logical trader book which also talks about the opening range breakout. The Narrow Range breakout patterns included the doji and spinning top Japanese candlestick patterns as these candles have small bodies illustrating the small trading range.

    Forex traders can look for a breakout to the upside when prices move above the wick high of spinning top or doji candlestick pattern. A break to the downside below the low the narrow range candle signals a sell.


    The Forex narrow range breakout trade is based on the typical price behavior that moves from periods of low volatility to periods of high volatility. Imagine price as a giant spring that can be compressed to a very compact and small size then when the spring is released, it expands to many times its original compressed size.

    As traders, we look for these compressions as they signal that a big move is around the corner. It allows traders to predefine their risk in the trade and to also calculate possible price objectives. In addition we would look to trade these breakouts in the direction of the dominant trend.

    What this means is that if the daily trend is up then we would only take topside breakouts above a narrow range candle’s previous high. In addition we would ignore sell signal. Similarly, if the daily trend is down, then we would ignore upside narrow range breakouts.
    On the other hand, if the daily trend is ranging in a sideways consolidation, then either upside or downside breaks can be traded.

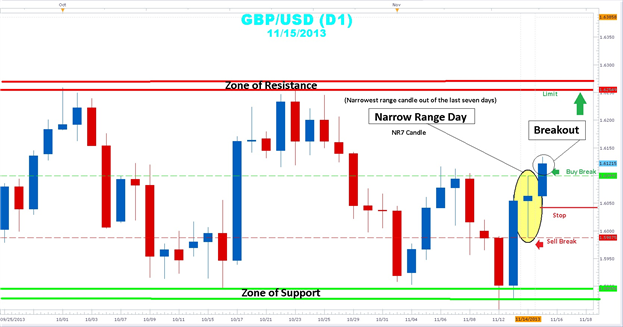
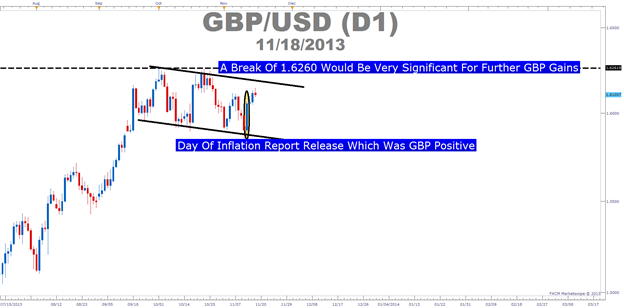
    Learn Forex: GBPUSD Narrow Range Breakout Setup


    Trading Example

    The current trading setup shows a GBPUSD daily chart with a spinning top at November 14th with a high of 1.6099 and a low of 1.5987. On November 15th, a wide rage candle broke the top of the spinning top candle. Aggressive traders can buy the breakout above the previous day’s high. Next, they would place a stop 5 to 10 pips below the low of the current candle. A limit can be set just below the new level of significant resistance in the 1.6250 area.

    On the other hand, more conservative traders will want to wait for the daily candle to close above the previous day’s high before entering long. A stop would be placed 5 to 10 pips below the low of the current candle. The dotted green and dotted red line mark the high and low of the range. A next day move above the high is bullish, while a next day move below the low is bearish. Since the daily trend is up we would ignore sell signals and only take buy signals as they are aligned with the trend.

    In sum, traders have a great opportunity to rejoin a very strong GBPUSD uptrend using narrow range candles as a trigger. It is important to note that whipsaws and pattern failures can happen not only with this strategy but other breakout strategies. So it is important that you use stops.

    ---Written by Gregory McLeod Trading Instructor

    More...

  2. #262
    member ForeCastle's Avatar
    Join Date
    Apr 2013
    Posts
    1,077
    Blog Entries
    236

    How To Target Resistance On JPY Crosses As They Breakout

    Talking Points

    • JPY Crosses Are Breaking Higher
    • Looking To Recent & Multi-Year Highs As Price Targets
    • Looking To Pivot Levels As Resistance For Shorter Term Trading


    JPY Crosses Are Breaking Higher

    Trend traders are often stuck in uncomfortable territory. When they’re riding the best trends they’re often most uncomfortable with their trading. This is because they are riding the front cart of a fast moving train into new territory and they’re never sure where it will stop.

    Learn Forex: Japanese Yen Crosses are Breaking Higher across the Board


    This is currently happening on JPY crosses as the next leg of JPY weakness appears to be underway. JPY weakness is causing pairs like USDJPY, GBPJPY, EURJPY and others to move higher. The backdrop of this move is that all forms of the Japanese government are working under a monetary policy that is set to put Japanese exports back on the main stage of the global economy and a weak JPY is a ticket to that stage.

    Looking to recent & multi-year highs as price targets

    If you’re trading a currency pair that is moving higher, then we hope you’re trading with the trend as that is the preferred approach that many of us take. If that new found uptrend is below the annual high but is approaching that level, then that is the next level to target. In addition to that point, from a technical trading point of view, if there are price peaks that are below the annual high, then you would target those prices as a testament of current trend strength. Naturally, if the price of the pair your trading blows through those prior price peaks on the way to the annual high then you’re in a very strong trend and it may be a good time to tighten stops.

    Learn Forex: USDJPY is targeting prior peaks as the 2013 high of 103.72 looms


    Looking above, you can see that the USDJPY has broken the trendline resistance which means that underlying strength is building. Now that the chart is showing strength, we can look to prior highs of 2013 as price targets. In September, the high of USDJPY was 100.60 so that would be the near term target. However, it is up to you if price reaches that target if you want to get out at a hopeful profit or stay in the trade to see if price makes its way to the July high of 101.52.

    Either way, you can use prior highs of the trading year as trading targets when trading trends. However, what do you do if you’re at the price high for the year? While this can be uncomfortable because price feels too high or overbought, there are still targets you can look to in past years to get a sense of a trend target.

    Learn Forex: GBPJPY Is Trading At 2013 Highs So Look To 2009 Highs as Targets


    Looking above, you’ll notice a longer term chart of the mighty GBPJPY which has taken out the 2013 highs. For traders who are riding this trend to the upside, you can look to prior annual highs as a targets. In August 2009, GBPJPY peaked at 163.08 before turning over. Similar to the USDJPY example above, we can use that level as a target for the current trend. If price falls short of that move and starts to move lower then we have a clue that the current trend is losing steam. If GBPJPY takes out the 2009 high then you can use that as an opportunity to stay on the train and simply tighten your stops.

    Looking To Pivot Levels as Resistance for Shorter Term Trading

    The examples used earlier were longer term targets. Understandably, many traders aren’t comfortable holding a trade that long and would rather look for shorter term and closer targets. In that scenario, it’s hard to find a more objective and easier tool to use than Pivot Points.

    Learn Forex: Pivots Can Also Be Helpful for Short-Term Targets beyond Highs


    The benefits of Pivot Points are many but among my favorite is their objectivity. If an uptrend is picking up steam then you’ll likely see resistance points taken out. In a strong downtrend, you’ll likely see support pivots getting hit showing weakness in the pair. Therefore, once you’ve identified the trend but would like to take a shorter term trend trading approach, you can use pivots as a helpful gauge of when to get out of a profitable trade or exit a losing trade.

    Closing Thoughts

    Trend trading is a great strategy but it’s not without challenge. This article walked through using previous price action highs or pivot points as targets when trading a strong trend. Your preference to either approach should depend on your time horizon for holding a trade.
    Happy Trading!

    ---Written by Tyler Yell, Trading Instructor

    More...

  3. #263
    member ForeCastle's Avatar
    Join Date
    Apr 2013
    Posts
    1,077
    Blog Entries
    236

    How to Read a Candle Chart

    Talking Points:

    • Candlestick charts are a prominent and helpful tool in the Forex Market
    • Open and closing prices will determine a candles body and wicks.
    • Multiple candles may develop patterns useful in trading.


    What could possibly be more important to a technical Forex trader than their price charts? Your perception of price will ultimately help shape your opinions of trends, determine entries, and more. With this in mind it becomes absolutely critical to understand what you are seeing on your trading monitor. More often than not Forex charts are defaulted with candlestick charts which differ greatly from the more traditional bar chart and the more exotic renko charts that you may come across in your trading career. Surprisingly after learning to analyze candlesticks, traders often find they are able to quickly identify different types of price action that they could not quickly identify before with othertypes of charts.

    To begin with, traders need to understand exactly how to read candlesticks before adding them into an existing
    trading strategy. So let’s get started learning about how to read a candlestick chart!


    How to Read Candles

    The image below represents the design of a typical candlestick. There are three specific points (open, close, wicks) that are used in the creation of a price candle. The first points we need to consider are the candles open and close prices. These points identify where price began and concluded for a selected period and will construct the body of a candle. If you are viewing a daily chart for instance, these points will represent the daily open and close price. It is important to note the color of the body of a candlestick (red for down and blue for up). Knowing this, candlesticks can help us quickly identify if the market is trading higher or lower for a selected time frame.
    Next we have the wicks of our candlesticks, which may also be referred to as the candles shadow. These points are vital as they show the extremes in price for a specific charting period. The wicks are quickly identifiable as they are visually thinner than the body of the candlestick. This is where the strength of candlesticks becomes apparent. Candlesticks can help us keep our eye on market momentum and away from the static of price extremes.


    Using in Trading


    As you can now see, candlesticks are easy to read with a little bit of practice. Once you understand the basics, they have the ability to open up an array of trading opportunities. While a trader may not employ candlestick analysis alone in their strategies, Forex professionals do use them to gauge market sentiment and market direction. Now that you are familiarized with the basics your next step is to continue learning by reviewing candle patterns, such as the bullish engulfing pattern, which can be used in conjuncture with a strong trending market.

    ---Written by Walker England, Trading Instructor

    More...

  4. #264
    Senior Member matfx's Avatar
    Join Date
    Sep 2013
    Location
    Malaysia
    Posts
    1,178
    Blog Entries
    114
    Follow matfx On Twitter

    How to Develop a Forex Trading Strategy

    There are countless ways to develop a forex trading strategy, though the particular strategy adopted by a trader is usually dependent on the individual trader’s appetite for risk. Strategies range from the more conservative, low risk approach, the medium risk approach or at the most extreme, the aggressive high risk strategy.

    What Sort of Trader Are You?

    The most important way to develop a forex trading strategy is to first ascertain what sort of trader you are. Some traders are ‘day’ traders, meaning that when they perform currency trading, they keep positions open for a few minutes to a few hours, but never overnight.

    Others are short or medium-term traders, which means that they buy and sell currencies within the space of a couple of days or weeks. There are also long-term traders, who keep positions open for any number of weeks or even months. Finally, there are swing traders, who select active, popular currency pairs and open positions with those pairs when they are heading in a particular direction for a few days, and then head in a different direction for a few days. This is considered a favorable trading technique for beginners to the market.

    How Do You Develop a Trading Strategy?

    Although there are different ways to develop a trading strategy, two of the most popular methods are through technical analysis and fundamental analysis, or a combination of the two.

    Technical analysis is based on the analysis of past price movements using charts and graphs. Traders using technical analysis look for patterns as a way to spot what is happening in the market in order to perceive future price movements. Fundamental analysis takes a more macro approach. It is the analysis of trading news and major global events as a way to understand why the market has moved in a certain direction.

    A combination of the two is recommended by traders, since it is difficult to use technical analysis without acknowledging the occurrence of some major political, economic, natural or social events. However, finding an approach that you are more comfortable with is a great step towards developing a trading strategy. Most forex brokers provide the necessary trading tools and resources in order to conveniently perform both of these methods.

    Moreover, there are numerous types of orders that you can place in order to calculate and better manage your risk. For example, you can set up stop loss and take profit orders, if desired, which are the ideal way to close a trade before it drops in value once it is increasing in value.

    There are also strategies developed for riskier traders, including scalping, which involves the opening and closing of positions within a short period of time in order to capture some profit from small pip movements.
    Follow my official trading theregulartrader blog

  5. #265
    member ForeCastle's Avatar
    Join Date
    Apr 2013
    Posts
    1,077
    Blog Entries
    236

    How Fundamentals Move Prices in the FX Market

    Talking Points:

    • Fundamental Analysis in the Currency markets centers around Macroeconomic data
    • Macroeconomic analysis can be simplified by focusing on interest rates (and expectations)
    • Traders can incorporate Price Action to make analysis even more simplistic


    Fundamental Analysis in the stock market involves analyzing the inputs of a company in an effort to forecast future growth potential. For an individual company, this can be a very logical way to look for investment ideas.

    Fundamental Analysis of a company would involve investigating that company’s financial statements, to notice changes from one year to the next; or perhaps looking that the management of that company, and their track record in order to determine how successful they might be towards accomplishing their goals.

    In the Forex market, many of those statistics don’t exist, and we’re trading entire economies against one another. In each of these economies, thousands of companies exist trying to maximize their profit potential, so the analysis of a single company’s management structure or market share doesn’t really mean a whole lot.

    Due to the nature of the market, many traders refer to technical analysis, and we showed you how fundamental data events can be traded with technical analysis in the article The Potent Combination of Fundamentals and Price Action. In this article, we’re going to go in-depth behind how fundamentals impact prices in the FX market.

    Why Currency Values Matter

    Currency prices matter because of cross-border trade. We investigated this concept in-depth in The Nucleus of the FX Market. In the article, we saw how the nation of Japan was absolutely ravaged by a strong yen; as a stronger yen meant lower profits and margins for Japanese exporters.

    The concept of Fundamental Analysis in the Forex Market can be all boiled down to one simple data point: Interest Rates. If interest rates move higher, investors have a greater incentive to invest their capital; and if interest rates move lower, that incentive is lessened. This relationship is at the heart and soul of macroeconomics; and this is what allows Central Bankers to have tools to steward their respective economies.


    The decision to increase or decrease rates can bring impact to other economies as well. Let’s say, for instance, that you are an American with cash to invest. After having little incentive and extremely low rates for a long time, you notice that The United Kingdom increases rates 25 basis points. This increase in interest rates from the Bank of England can and should bring higher rates in other issues from The United Kingdom; so you may not necessarily buy Gilts or a government bond, but investors can now look to invest in England to get that higher rate of return.

    Additional investors thinking the same thing rush into UK bonds, and eventually – the price of the British Pound will go up to reflect this additional demand. Now it becomes slightly more difficult for the UK to export goods (similar to the problem Japan faced in The Nucleus of the FX Market).

    A great example of this was in Australia from 2002 leading up to the Financial Collapse; as insatiable demand from China drove growth throughout Australia, unemployment got very low and inflation moved very high. The Reserve Bank of Australia (RBA) moved to increase interest rates, and currency prices followed.

    The Aussie more than doubled while RBA moved rates from 4.25% to 6.75%


    This is an interest rate cycle, and it drives capital flows that are at the heart of the FX market.

    How Interest Rate Cycles Drive Economies

    It all goes back to the incentive to invest. If Central Bankers want to slow down their economy, they look to raise rates. If they want to encourage more growth within an economy, they look to decrease rates.
    Higher or lower rates bring a two-pronged impact on the economy.

    The first and most obvious impact is the incentive to invest. If rates increase, that incentive to invest also increases; and if rates decrease, so does the incentive to lock up one’s money.

    The second impact is what this does for capital expenditures. If rates decrease, the attractiveness of locking up a long-term loan at the new lower rate is much higher than it was previously. The incentive to buy big-ticket items like homes, and cars is now higher.

    And when you buy a home or a car, the homebuilder or car maker has to turn around to pay for their materials and workers. If the lower rates increase the number of homes or cars that are being purchased, this amounts to growth. Homebuilders and car makers will eventually have to hire new workers to keep up with the demand; and as demand for workers increases, so will the wages that are needed to attract qualified candidates.

    This is how lower interest rates can bring higher employment and inflation (often shown as CPI or ‘Consumer Price Index’); and it’s at this point that Central Bankers are going to investigate increasing rates in an effort to prevent the economy from over-heating.

    If interest rates stay low, the effects of ‘over-heating’ could be immense. Prices can continue inflating, and if left unchecked – could bring hyperinflation.

    Imagine going to the store to buy a gallon of milk and seeing the price at 27 dollars. I don’t know about you, but I’d freak out at seeing something like this. Then my mind would wander to other areas where costs might be increasing. If a gallon of milk is 27 dollars, then how much will that new car cost me? How much is milk going to cost tomorrow?
    So, Central Banks want a moderate rate of inflation. This helps to keep growth within an economy; people get pay increases, more people are working and paying taxes, and consumers have the confidence that they can save their money for tomorrow because prices won’t increase a hundred-fold overnight.

    What do Central Bankers Watch?

    Both Central Bankers and Forex Traders watch macroeconomic data prints with the goal of getting something out of them; but their objectives are slightly different.

    FX Traders are often interested in the price reaction of a data print. If CPI comes out higher than expected, then traders may be looking for long positions to move higher.

    FX Traders can price in new data quickly, creating volatile price movements


    Central Bankers, however, take a much more broad view on such statistics.

    Central Bankers want to watch the primary points of reference for an economy in an effort to make the correct decision as to where to move rates.

    Inflation and employment are chief amongst these statistics, as these are two of the primary pressure points within an economy. If unemployment is high, the economy will likely struggle. As employment/unemployment prints are released out of an economy, this new information is factored in fairly quickly. FX Traders will begin pricing this in with the probability of an eventual rate hike or cut by Central Bankers to factor this information in.
    Same for inflation: As inflation (CPI) data prints are released in an economy, traders will act quickly to incorporate this new information in to prices. Meanwhile, Central Bankers are watching cautiously to decide if they want to do anything at their next meeting.

    Increasing unemployment (decreasing employment) along with decreasing inflation are threats to an economy that will usually see Central Bankers investigate rate cuts.

    Decreasing unemployment (increasing employment), and increasing inflation are signs of a growing economy, and this is when Central bankers will look at potential rate hikes.

    But, Central Bankers and Forex traders alike are not happy to just sit around and wait for employment or inflation numbers to show changes within an economy. This has brought to light numerous additional data prints that traders and investors will look to in an effort to anticipate changes to inflation, unemployment and interest rates.
    Consumer statistics are extremely important in large economies like The United States, or Europe in which consumer activity has a heightened level of importance for the global economy. In the article, The Lifeblood of the US Economy, we looked at the major data releases that include this information. The Euro can get extremely volatile around releases of Consumer Sentiment Numbers, and this is because consumer activity in established economies is often looked at as a precursor to inflation, employment, and growth.

    GDP, or Gross Domestic Product, is a direct expression of growth (or contraction) within an economy, and this can also be a huge precursor to price movements; especially if the announced rate of growth is far away from expectations. But, in and of itself, increases or decreases in GDP don’t bring more jobs or higher inflation, so this is often looked at as more of a ‘lagging’ fundamental indicator.

    Production numbers can be especially important in growing economies that are at a very industrialized stage of the growth process. China is a phenomenal example; as each months ‘PMI’ (Purchasing Managers Index), will draw massive interest from numerous parties around the globe.

    PMI is a survey that’s recorded from producers gauging their sentiment on future orders. The thought behind this statistic is that if producers are seeing growth, then that growth will eventually cycle through to consumers; after all, if someone wants to buy a good, it has to be produced in the first place, right?

    Bullish Data Bearish Data
    Higher GDP Lower GDP
    Higher Inflation Lower Inflation
    Higher Employment Lower Employment
    Lower Unemployment Higher Unemployment
    Higher Consumer Confidence Lower Consumer Confidence
    Higher PMI Lower PMI

    Regardless of the data print or release, the market’s reaction always comes back to interest rate cycles, and how that improvement or decline in measured activity might eventually amount to an interest rate increase or decrease.
    How to Trade Fundamentals

    A line that I used in The Potent Combination of Fundamentals and Price Action is a line that I say quite a bit in webinars and live events:
    ‘Not only do you not know what any given data print might be, but you aren’t entirely sure of how the market might price it in.’

    This makes trading on fundamentals in the FX market dangerous; because you could guess that GDP is going to come out better than expected, and you can trade it accordingly and still eat a stop. You can be right, and still lose.

    In stocks, trading on fundamentals makes a lot of sense. You can grade company A versus company B in relevant markets. You’re trading one small part, of one economy, in the larger global macroeconomic environment.
    The market capitalization of any company that you’re trading might be a few hundred billion, at most. The currency market turns over north of $5,000,000,000,000 every day. That’s 5 trillion, and this is on the low-side of estimates.
    You’re trading entire economies against each other, and it can be much more difficult to use fundamental points of reference in an effort to project future growth potential.

    For this reason, many traders in the FX market incorporate or include Technical Analysis in their fundamental trade ideas. This can bring quite a bit of benefit to the trader in helping to determine trends or biases that may have been exhibited in a currency.

    How Technical Analysis can improve your fundamental approach

    Earlier in the article, we used the hypothetical example of the Bank of England increasing interest rates 25 basis points. When this happens, we’ll generally see traders buying the British Pound to get this new, higher rate.
    But, it’s not only rate hikes that will see buying the Forex market; as traders don’t want to wait around to see a Central Bank do what they know that they’ll probably do anyways.

    So, as we see increasingly positive data coming from the UK; data that may eventually amount to an interest rate increase, we’ll see increased demand for the British Pound. This increased demand will show higher prices.
    So, this is a fundamental theme – that is clear and apparent in the technical setup of the chart. If there is an up-trend, prices are moving higher for a reason, right?

    Prices can show biases and trends in fundamental data


    Traders can incorporate price action to see where these trends may be existing, and to what degree they might be traded. Then, traders can also use price action to buy up-trends cheaply, and sell down-trends expensively; so that if that momentum continues, they can look to profit.


    More...

  6. #266
    member ForeCastle's Avatar
    Join Date
    Apr 2013
    Posts
    1,077
    Blog Entries
    236

    Why You Should Target Trades based on Central Bank Policy

    Talking Points

    • Why is a Central Bank’s Monetary Policy Important for Forex Traders?
    • Where do Central Bank's Monetary Policy Currently Stand?
    • What Trades Are Attractive Pairings of Monetary Policy Imbalance?


    Trading the Forex market places an unusual emphasis on Central Bank policy and rate announcements that are not as common in other markets, albeit still very important. The effect that monetary policy has is paramount to currency outcomes and can be a major determinant in what trades you decide to place. This is because monetary policy is the process by which a monetary authority like a central bank controls the supply of money within an economy in order to support economic goals.


    Why is a Central Bank’s Monetary Policy Important for Forex Traders?

    As a trader, it’s always important to recognize where a trade opportunity lies. One of the cleanest fundamental set-ups is when you have one central bank that is looking to tighten money supply due to an overheating economy, which shows underlying strength, and another economy’s central bank that is looking to loosen monetary policy, which weakens the currency in order to jump start the economy. On the other end, if you have two central banks with very similar monetary policy goals then the trade set-up may not be as clear.

    This clear imbalance or disparity between two economies' central bank policies makes this an important distinction for you to be aware of for trading purposes especially when price action aligns with the fundamental imbalance. The rest of this article will break down where central banks currently stand and what opportunities lie within the imbalances. Furthermore, if this is information that you find helpful as I believe it will, then we can make this an ongoing piece for you and your trading.

    Where do Central Bank’s Monetary Policy Currently Stand?

    Federal Reserve – US DOLLAR


    The big stories behind the US DOLLAR and their central bank are the changing of the guard where Janet Yellen will take over for Ben Bernanke as head of the Fed as well the eventual taper of current easing efforts. Since July of this year, the USDOLLAR has weakened significantly as the underlying measures of economic health like inflation and employment have not improved enough for the Fed to confidently begin tapering their easing efforts. Also of importance, Janet Yellen, the new head of the Federal Reserve starting in 2014 has asserted that she will continue to be accommodative and work not to begin tapering, which would be US Dollar positive, until the underlying economic indicators show continuance strength.

    Bottom Line: The US Dollar may continue to trade lower and retest the price channel floor or possibly break it as The US Dollar remains comparatively weak to other major currencies.

    Bank of England –Pound Sterling


    As of last week, the Monetary Policy Committee of the Bank of England have recently upgraded their forecasts of an economic recovery in their inflation report. A few weeks earlier, BoE governor, Mark Carney, mentioned that he would be looking for an improvement in key economic indicators before they tighten their current monetary policy.
    Bottom Line: The inflation report upgrade last week seemed to be the signal the market wanted as the GBP is now seemingly leading other economies out of the 2008 crisis which weakened many major currencies. A break of 1.6260 would be a key technical development for further GBP Strength.

    European Central Bank – Euro


    The market was shocked two weeks ago when the ECB decided to cut their already historically low central bank reference rate to 0.25%. This move was on the back of a paltry inflation reading which showed current inflation, which is an elementary reading of economic demand was at lows not seen since after the 2008 credit crisis and 2010 Sovereign crisis when Greece came to the forefront. This cut of interest rates has many looking to the December meeting of the ECB to provide further clarity on how weak the Euro may become.

    Bottom Line: The euro faces one of its most uncertain fates in the last 3 years. It appears the sole focus of the ECB on inflation will cause them to fight the foe of disinflation which could keep the Euro under pressure for months to come.

    Bank of Japan – JPY


    Over the last year, Japan has led global currency wars in order to get their economy out of 20-year deflationary downward spiral. The current effort led by new Prime Minister, Shinz

    More...

  7. #267
    member ForeCastle's Avatar
    Join Date
    Apr 2013
    Posts
    1,077
    Blog Entries
    236

    EURCAD Forex Pin Bar

    Talking Points
    - Long Wicked Candles can mark significant reversal points at key areas of support and resistance
    - Long Wicked Candles show excessive bullishness and bearishness that can be faded
    - Though a lagging indicator, a MACD crossover can confirm a change in momentum

    Traditionally, aggressive traders enter at market after a Forex Pin Bar is formed. However, the stop placed below the tail of a pin bar could be 200 or more pips. Many times, price will retrace back below the pin bar low stopping a trader out. In other instances traders end up getting chopped up in the market or face an opposing pin bar before exiting the trade at a loss.

    Another approach would be to use a lagging indicator, like MACD, to confirm the reversal that was first indicated by the pin bar. Since the pin bar is short for Pinocchio bar, the fictional talking wooden puppet whose nose would grow when he told a lie, MACD can be used like a “lie detector” to confirm if the pin bar is “lying “ or “telling the truth”

    Learn Forex: EURCAD Daily Chart Pin Bar


    In the example chart, we can see a strong EURCAD daily chart uptrend. A rising trend line created by a connecting the July 11th swing low at 1.3430 and the September 6th swing low at 1.3651 was successfully tested on November 7th by pin bar at 1.3884. The following day’s candle retraced nearly 62% of the pin bar before rebounding to the top of the pin bar at 1.4094. After ranging a bit, MACD starts moving towards its signal line and we get a large range confirmation candle breaking out of the congestion. Because MACD is an indicator composed of moving averages, it will, by nature lag behind sharp volatile moves and generate fewer false signals. This extra measure of safety is not without a cost, as price could continue to move and not retrace leaving the conservative trader behind. Traders who use this method must accept the fact they may miss trading opportunities.

    Placing a stop below the area of congestion and targeting the November highs near 1.4413. We gave up about 90 pips on the trade in order to line up more confirming signals to take this trade but there is still close to 250 pips left and the risk to reward ratio is better than 1:2. MACD crossing over its signal line, combined with a continuation breakout following a bullish daily chart pin bar stack up for a solid trade.

    --- Written by Gregory McLeod, Trading Instructor

    More...

  8. #268
    member ForeCastle's Avatar
    Join Date
    Apr 2013
    Posts
    1,077
    Blog Entries
    236

    Learn FX: The First of Ten Trades

    Talking Points

    • Use probabilities to guide the way we approach the market
    • DailyFX’s Traits of Successful Traders Research shows traders place too much emphasis on each individual trade as they risk a lot to make a little
    • De-emphasize each trade by thinking of your next trade as the first in a ten trade sequence


    Assume you were playing a dice game using a six sided die and given the choice of two different scenarios below (Option A & Option B). Which would you choose?
    Option A – Obtain a ‘one’ reading on one roll
    Option B – Obtain a ‘one’ reading at least once with six consecutive rolls


    When asking several folks this very same question, they opt for Option B. The logic is simple. You have more opportunities to obtain the winning number in the second option.

    The statistics support this. The chance of success in Option A is 17%. The chance of success in Option B is 66%.
    In fact, if we expand out the number of rolls to ten, then chances of success increase even more to 83%.
    Now, let’s twist around and look at this game from a slightly different angle.

    The outcome in Option A places too much emphasis on one sole result…the result of rolling the die once. There are only 6 outcomes (a ‘one’, ‘two’, ‘three’, ‘four’, ‘five’, ‘six’) of which I win in only one instance.

    With Option B, there are 46,656 potential outcomes. My chance of success on the first roll is still 1 in 6 (17%), but whether I win on the first roll is not as important as it is for Option A above because I have 5 more rolls after it to succeed.

    As a result, I have essentially spread out my risk and diversified that risk across multiple rolls.
    Though the logic makes intuitive sense, as traders we tend to do the opposite. We see a great trade set up and risk too much on that single trade. Then, if the market moves against our trade, we get stopped out and sustain a significant loss.

    That is why you will hear many professionals talk about ‘staying power’. That is the ability of your account to withstand a drawdown on equity. Improving your account’s staying power means implementing conservative amounts of leverage so when that losing trade or sequence of losing trades take place, you will still have the bulk of your account capital left over for a potential winning trade in the future.

    We’ve researched behaviors like these at DailyFX and found that one of the large reasons why traders lose is because they rely too much on the next trading opportunity. Said another way, they expect too much on the next
    trade which emotionally attaches them to the results of that individual trade.

    Forex Education: Average Losers Outpace Average Winners


    According to our Traits of Successful Traders research, the winning trades on average produced 52 pips while the losing trades lost an average of 94 pips. Clearly traders were risking a lot to make a little.
    Once that trade was slightly in the positive, nervous traders would then close it down for a small profit. On the other hand, that same trade deep in the negative was living on the hope of turning around and if it never did, there was a large loss.

    Again, the simple problem is that too much weight was given to each individual trade. Otherwise, why would the average trader close out a profitable trade early and let a loser run longer?

    Although it is easy for me to say “risk less on your trades by implementing appropriate amounts of effective leverage,” the true obstacle in our way is our own minds. We need to re-evaluate how we view trading.

    I want to encourage you to think about your next trade like it is the first in a ten trade sequence. That way, you should be less concerned about the profit or loss on that one trade and let the strategy do its work. Then, after that trade closes, think about the next trade as the first of a ten trade sequence. Continue that line of thought until you have made 100 trades.

    After 100 trades, go back and review the profit or loss results in blocks of 10 trades. Was the block of ten trades net positive or net negative? What was the average size of your average winner and your average loser? Does the size of your average winner larger than your average loser?

    If your block of trades are producing net profits and if your average winner is larger than your average loser, then congratulations! You have been able to de-emphasize each of your trades and let the strategy work.
    This article was the fourth part on trading FX with discipline.
    Part 1 – Trading is Methodical – Markets are Emotional
    Part 2 – Take what the Market Gives You
    Part 3 – Disciplined FX Trading – Touching Lines

    ---Written by Jeremy Wagner, Head Trading Instructor, DailyFX Education

    More...

  9. #269
    member ForeCastle's Avatar
    Join Date
    Apr 2013
    Posts
    1,077
    Blog Entries
    236

    SSI for Forex Scalpers

    Talking Points

    • SSI is a positioning tool gauging market sentiment.
    • Scalpers will use SSI extremes to identify Forex trends.
    • An extreme negative GBPJPY SSI reading may lead to continued bull trend bias.


    SSI (Speculative Sentiment Index) is a proprietary trading tool offered to FXCM clients through DailyFX PLUS. This tool has been adapted for Forex currency pairs and CFD contracts and its primary use is to confirm market trends. Once you have familiarized yourself with SSI, it is a great component to work into any existing scalping strategy. Today we will work to get up to speed with this resource, while looking at its uses in day trading.

    Learn Forex – Current SSI Readings


    SSI and Scalping

    First, SSI is a calculated ratio that gives us a snapshot of trader positioning while giving hints on market direction. SSI reveals trader positioning by determining if they are net long or short a currency pair, and if so by how much. Above we can see SSI as displayed through DailyFX Plus. With the GBPJPY reading at -3.33, this means there are 3 and 1/3 positions short for every position that is long. The higher this number becomes, the more extreme SSI is considered.

    As a scalper the number one priority is to find the Trend. As most traders attempt to fade trends, scalpers should use a contrarian approach to SSI. This means if SSI has extreme negative reading, like on the GBPJPY, traders should look for the trend to be upward. Conversely if SSI has an extreme positive reading that means the majority of positions are likely to be fading an existing downtrend.

    Let’s take a look at SSI in action.

    Learn Forex – Current GBPJPY Trend


    SSI and the GBPJPY

    Currently we can see that the GBPJPY trading 483 pips higher from its November the 5ths low at 156.93. As this trend has ramped up, the majority of traders have been selling into strength attempting to find a top to the pair. As selling positions have increased, this has signaled new BUYING opportunities for scalpers. The key to remember is that a negative reading of SSI indicates that a strong uptrend is in play. Once this is established traders can assume the strategy of their choosing.

    When adding any new component to an existing strategy it is always important to track your progress. You can do this easily, by running a report inside the FXCM Trading Station. Then, review your progress and see if SSI and scalping is for you!

    ---Written by Walker England, Trading Instructor

    More...

  10. #270
    member ForeCastle's Avatar
    Join Date
    Apr 2013
    Posts
    1,077
    Blog Entries
    236

    Keys to Successful Trading: Matching Personality with Trading Style Part I

    Talking Points
    - Short-term scalping, intra-day, swing, position, automated are the five major types of trading
    - According to Jack Schwager, author of Market Wizards, successful traders usually match one of the five types of trading with their personality type
    - Traders who choose a trading method that is contrary to their personality have difficulty sticky to their trading plan

    Traders come from many different backgrounds, cultures, and have different personalities. People bring their beliefs and behavioral patterns to the market. These personality traits can sometimes be a great asset and benefit with certain types of trading. However, in other types of trading, certain personality traits can hold back a trader. So it is very important for the trader to remember the Latin phrase “Temet Nosce” Know Thyself. By matching their personality with the appropriate trading style, they are more likely to stick with a trading plan because it matches the natural decision making process that they do every day.

    On the other hand, if a trader chooses a type of trading that is contrary to their behavior, they will more than likely experience stress, frustration, and failure. This applies to other professions and is not confined to trading. Think of a person who yearns to be a photographer, but is pressured by parents to join the family business. This person may not be suited for this profession and not excel at it.


    The great thing about FOREX trading is that there is a type of trading to go with your personality. If you are an analytical person who needs lots of information and time to make a decision, you may be fascinated and attracted by the quick action and potentially quick profits of short-term scalping. However, you may discover that it is uncomfortable to make quick decisions or to take a signal from a setup because it is not natural for you to act so quickly. This can be a recipe for disaster because when analytical traders finally decide to enter a trade, it is too late as the profit windows are small and close quickly.

    Analytical traders will then not exit the trade quickly for a loss because it is unnatural for them to make a decision without having more information and more time. These are two commodities in short supply for scalpers. Therefore losses compound quickly and frustration sets in.

    On the other hand, the swing trading or position trading style may be more suited to analytical traders. Since these trades can last over a span of several days or weeks, analytical traders have much more time to prepare for trade and are reluctant to take the quick profit. The process of reviewing economic reports, news releases, trade balance numbers, and technical like trend direction, support and resistance levels is enjoyable and is suited to the thinking analytical person.

    Swing trading entries are not as time dependent as it is for scalping. Swing trading is a trend following approach that can lead to profits in hundreds of pips. Analytical traders will be suited to this type of trading because they have time to incorporate lots of data before making a decision. They also can reap large profits from a trend following approach.

    Though this approach may be a good fit for the thinker or analytical trader, swing trading may not be for active and driving personalities. In part II, we will discuss the types of trading that active and driving personalities may be best suited.

    --- Written by Gregory McLeod, Trading Instructor

    More...

Page 27 of 43 FirstFirst ... 17 25 26 27 28 29 37 ... LastLast

LinkBacks (?)

  1. 10-09-2013, 09:11 PM

Tags for this Thread

Bookmarks

Posting Permissions

  • You may not post new threads
  • You may not post replies
  • You may not post attachments
  • You may not edit your posts
  •