
 6Likes
 LinkBack URL
 About LinkBacks


Talking Points:
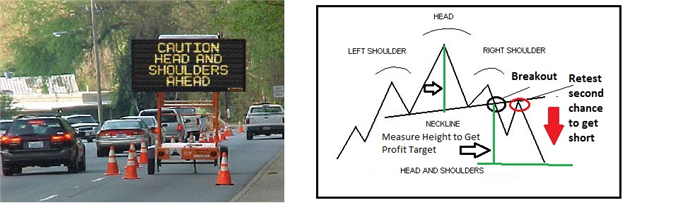
- The Head and Shoulders is bearish reversal pattern consisting of a higher swing high with lower swing highs on either side.
- A rising trend line drawn along the bottom of the pattern can be used as a sell zone
- Measuring the distance in pips from the top of the pattern to the neckline give a conservative profit projection.
According to Thomas Bulkowski, author of The Encyclopedia of Chart Patterns, the Forex head and shoulders price pattern is tied for the number 1 spot for best performing chart patterns alongside the Forex bull flag pattern. As with all most patterns, they give Forex traders valuable clues in determining future price direction and act as road signs along the trend highway. There are rules that must be observed when this pattern is recognized. Knowing where to enter, where to exit for profit and knowing where to exit if this pattern fails are the three things that traders need to get from this pattern.
First of all the bearish head and shoulders pattern can occur in an uptrend as well as a downtrend. It consists of an initial price surge upward followed by a sharp pullback forming the first shoulder. Bargain hunters usually pile in push price higher to form a new high peak establishing the head. Prices pull back completing the head and forming a second trough or “armpit”. A rising trend line called a “neckline” can be drawn connecting the two “armpits” or troughs. Traders are now looking for a higher high to confirm an uptrend, however price fails to make a new high and makes a lower high instead and returns back to the neckline. This lower high forms the right shoulder and signals traders that the trend is about to change. Price needs to close below the neckline for this pattern to be valid. Once price close below the neckline, a protective stop can be placed a few pips above the right shoulder. By measuring the distance from the top of the “head” to the “neckline”, Forex traders can determine, with some precision, a profit objective. Whipsaws are possible so if price were to close below the neckline and then move back above the right shoulder, this would be regarded as pattern failure.
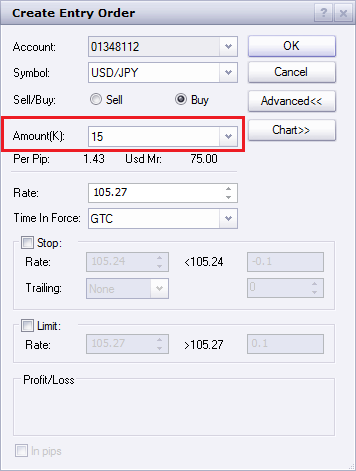
The Trade Setup
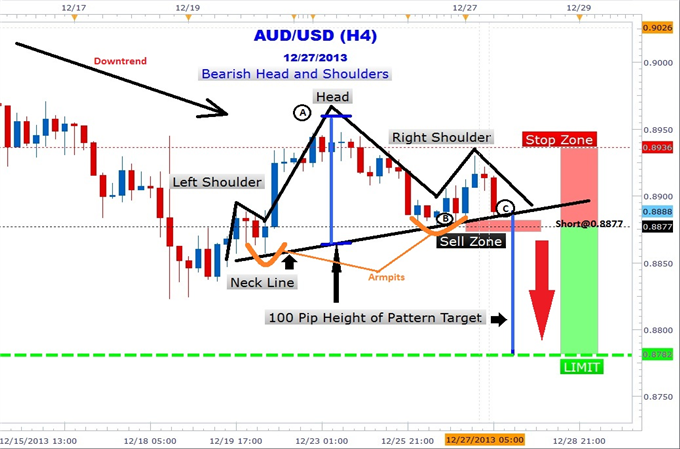
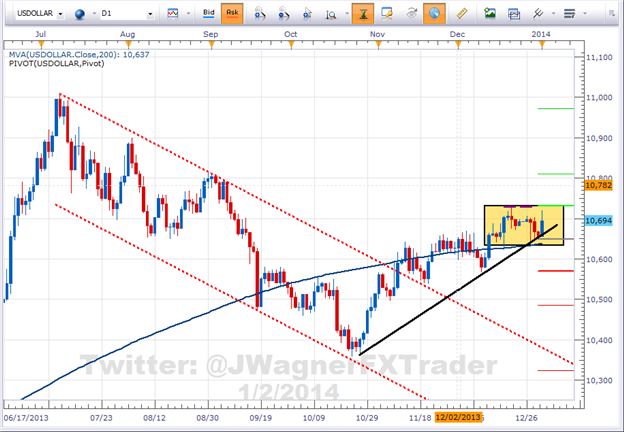
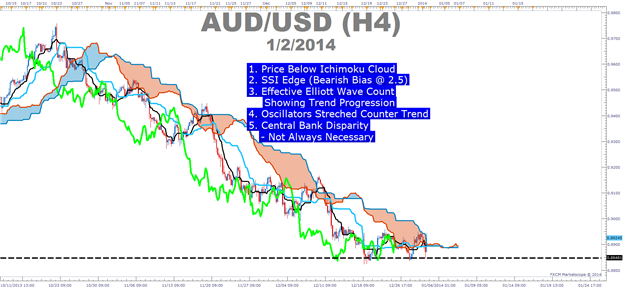
The Aussie US dollar pair has been in a down trend has rallied form the 12/18 lows of 0.9923 to a high just above the 0.8959 area. AUDUSD’s inability to hold onto the 0.8900 handle only reinforces the bearish sentiment surrounding this pair. On 12/19 the left should was put in with a high of 0.8885, and the head’s peak was put in at 0.8957 on 12/23 and the peak of the right shoulder was made at 0.8927. By connecting the troughs 0.8854 on 12/20 and 0.8874 on 12/26 a neckline trend line can be created.
A close below the neckline will be our trigger to enter this trade at or around 0.8877 with a stop placed above the right shoulder at 0.8936. A profit objective of 0.8782 could be set. Forex traders can benefit from being able to recognize this easy to trade pattern. See how many more you can find!
--- Written by Gregory McLeod, Trading Instructor
More...


 Reply With Quote


Bookmarks