Page 61 of 145 FirstFirst ... 11 51 59 60 61 62 63 71 111 ... LastLast
Results 601 to 610 of 1449

Daily Market Analysis By FXOpen

This is a discussion on Daily Market Analysis By FXOpen within the Analytics and News forums, part of the Trading Forum category; Gold Price Could Correct Lower, Crude Oil Price Breaks Key Support Gold price climbed higher and traded above the $1,750 ...


  1. #601
    Junior Member FXOpen Trader's Avatar
    Join Date
    Dec 2020
    Location
    Asia
    Posts
    1,758
    Gold Price Could Correct Lower, Crude Oil Price Breaks Key Support


    Gold price climbed higher and traded above the $1,750 resistance. Crude oil price declined below the $86.00 and $83.80 support levels.

    Important Takeaways for Gold and Oil

    • Gold price found support near the $1,700 level and started a fresh increase against the US Dollar.
    • There was a break below a key bullish trend line with support near $1,772 on the hourly chart of gold.
    • Crude oil price gained bearish momentum below the $86.00 support zone.
    • There is a major bearish trend line forming with resistance near $84.40 on the hourly chart of XTI/USD.


    Gold Price Technical Analysis

    Gold price formed a base above the $1,700 level against the US Dollar. The price started a fresh increase and was able to clear the $1,720 and $1,740 resistance levels.

    There was a clear move above the $1,750 resistance and the 50 hourly simple moving average. The price even broke the $1,780 level and traded as high as $1,786 on FXOpen. Recently, there was a downside correction below the $1,775 level.

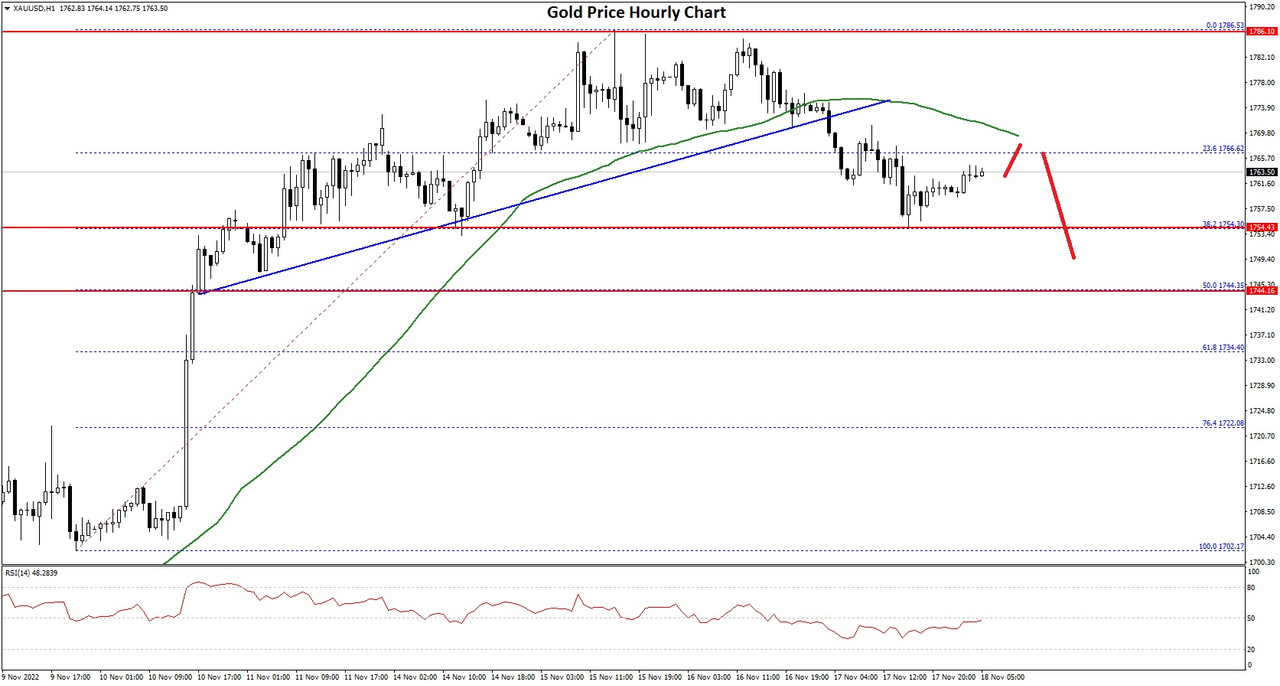
    Gold Price Hourly Chart


    The price traded below the 23.6% Fib retracement level of the upward move from the $1,702 swing low to $1,786 high. Besides, there was a break below a key bullish trend line with support near $1,772 on the hourly chart of gold.

    An immediate support on the downside is near the $1,755 level. The next major support is near the $1,745 level or the 50% Fib retracement level of the upward move from the $1,702 swing low to $1,786 high, below which there is a risk of a larger decline.

    In the stated case, the price could decline sharply towards the $1,722 support zone. On the upside, the first major resistance is near the $1,770 level.

    The main resistance is now forming near the $1,785 level, above which it could even test $1,800. A clear upside break above the $1,800 resistance could send the price towards $1,840.

    VIEW FULL ANALYSIS VISIT - FXOpen Blog...

    Disclaimer: CFDs are complex instruments and come with a high risk of losing your money.

  2. #602
    Junior Member FXOpen Trader's Avatar
    Join Date
    Dec 2020
    Location
    Asia
    Posts
    1,758
    Watch FXOpen's November 14 - 18 Weekly Market Wrap Video

    In this video, FXOpen UK COO Gary Thomson sums up the week’s happenings and discusses the most significant news reports.

    • How will Rishi Sunak affect the pound?
    • US may avoid recession whereas Europe may plunge deeper
    • EUR/USD rallies while USD/JPY takes a major hit
    • GBPUSD reaches 1.20, what's next?
    • Inflation in the UK hits high at 11.1% as US inflation goes down.


    Watch our short and informative video, and stay updated with FXOpen.


    FXOpen YouTube

    Disclaimer: CFDs are complex instruments and come with a high risk of losing your money.

  3. #603
    Junior Member FXOpen Trader's Avatar
    Join Date
    Dec 2020
    Location
    Asia
    Posts
    1,758
    GBP/USD Corrects Gains, USD/CAD Eyes Fresh Increase


    GBP/USD climbed towards 1.2000 before it faced sellers. USD/CAD is rising and might gain pace above the 1.3450 resistance zone.

    Important Takeaways for GBP/USD and USD/CAD

    • The British Pound was able to move above the 1.1800 and 1.1900 resistance levels.
    • There is a key bearish trend line forming with resistance near 1.1900 on the hourly chart of GBP/USD.
    • USD/CAD tested the 1.3220 zone and started a recovery wave.
    • There is a major bullish trend line forming with support at 1.3370 on the hourly chart.


    GBP/USD Technical Analysis

    After forming a base above the 1.1500, the British Pound started a steady increase against the US Dollar. GBP/USD gained pace for a move above the 1.1650 and 1.1800 resistance levels.

    There was a move above the 1.1900 resistance and the 50 hourly simple moving average. The pair even moved above the 1.2000 level and traded as high as 1.2027 on FXOpen. It is now correcting gains and trading below the 1.1950 level.

    GBP/USD Hourly Chart


    Recently, there was a move below the 1.1920 and 1.1880 support levels. The pair declined below the 50% Fib retracement level of the upward move from the 1.1764 swing low to 1.1951 high.

    It is now trading below the 1.1880 level and the 50 hourly simple moving average. On the downside, an initial support is near the 1.1835 area. It is near the 61.8% Fib retracement level of the upward move from the 1.1764 swing low to 1.1951 high.

    The next major support is near the 1.1765 level. If there is a break below 1.1765, the pair could extend its decline. The next key support is near the 1.1650 level. Any more losses might call for a test of the 1.1550 support.

    An immediate resistance is near the 1.1880 level. There is also a key bearish trend line forming with resistance near 1.1900 on the hourly chart of GBP/USD.

    The next resistance is near the 1.1920 level. The main resistance is near the 1.2000 level. If there is an upside break above the 1.2000 zone, the pair could rise towards 1.2120. The next key resistance could be 1.2200.

    VIEW FULL ANALYSIS VISIT - FXOpen Blog...

    Disclaimer: CFDs are complex instruments and come with a high risk of losing your money.

  4. #604
    Junior Member FXOpen Trader's Avatar
    Join Date
    Dec 2020
    Location
    Asia
    Posts
    1,758
    Pound's gains wiped off after tax-grab budget leads toward retail sales outlook


    The monumental and sustained decline in value that blighted the British Pound over recent months in which it almost went into freefall with no sign of an end suddenly began to show signs of improvement a couple of weeks ago when Liz Truss, the British Prime Minister to hold the shortest tenure in office in British history - just 44 days - resigned.

    Her resignation was considered a positive step by the markets, as along with her leaving her office, an equally short-lived stint in office for Chancellor of the Exchequer (Finance Minister) Kwasi Kwarteng also came to an end.

    During Ms Truss' 44 day term as Prime Minster, she ramped up the rhetoric against Russia, presided over a disastrous mini-budget which was canceled the moment she left office, and created a sense of nervousness in the markets.

    The pound began to recover after her tenure as Prime Minister ended, and although still very much in the doldrums and having not managed to reach 1.18 against the US Dollar which by contrast has been a very strong currency over recent months, the economic woes in the United Kingdom have been too grave to ignore.

    Last week, new Prime Minister Rishi Sunak along with new Chancellor of the Exchequer Jeremy Hunt unveiled their new budget, which was laden with significant socialist-style tax increases, right at a time when the economy is in limp-home mode following the hundreds of billions which flowed out of the coffers during 2020 and 2021 under Mr Sunak's watch as Chancellor.

    The pound crashed in value once again yesterday during the hours of the London trading session, and although it is not down to the low levels that it reached at the end of Ms Truss' tenure at Number 10 Downing Street, it did head back to the low 1.18 range.

    It appears that the confidence-busting high-tax budget which now causes the average British household to be even more cash-strapped during what is being dubbed a 'cost of living crisis', and the potential that some high net worth individuals or companies with international offices may move their wealth to more tax-friendly jurisdictions, has caused investors and traders to take a conservative view once again.

    This drop came in at exactly the time when earnings reports from many publicly-listed retail giants are about to be released, and whilst we do not know what those figures may be as yet, it is estimated by many analysts that they could be a bit lower than usual at this time of year due to people simply not having as much disposable income available as they once did, and the government's imminent interest rate rises which are estimated to reach around 5% by January 2023 as inflation soared over the 11% mark in Britain by Friday last week.

    By contrast, the United States, whilst still blighted by high inflation over the past year, is not fairing so badly at all. At the end of last week, inflation in the United States actually decreased to 7.7%, and whilst that may still sound a lot compared to the levels that it stood at by the end of last decade, it is far lower than the 10% it reached by the summer of this year.

    By no means is the United States economy out of the woods yet, but it is certainly showing signs of returning to some degree of fortitude.

    Britain, by contrast, battles on with serious challenges ahead.

    VIEW FULL ANALYSIS VISIT - FXOpen Blog...

    Disclaimer: CFDs are complex instruments and come with a high risk of losing your money.

  5. #605
    Junior Member FXOpen Trader's Avatar
    Join Date
    Dec 2020
    Location
    Asia
    Posts
    1,758
    BTCUSD and XRPUSD Technical Analysis – 22nd NOV 2022


    BTCUSD: Shooting Star Pattern Below $17110

    Bitcoin was unable to sustain its bullish momentum and after touching a high of 17110 on 15th Nov, the prices started to decline against the US dollar touching a low of 15509 on 21st Nov.

    The global demand for bitcoin continues to remain weak, and the prices are expected to break below the $15000 handle soon.

    We can see the formation of bearish engulfing lines in the weekly time frame.

    The RSI indicator is under 30 in the 4-hour time frame indicating the neutral signal and oversold markets.

    We can clearly see a shooting star pattern below the $17110 handle which is a bearish reversal pattern because it signifies the end of an uptrend and a shift towards a downtrend.

    Bitcoin touched an intraday low of 15524 and an intraday high of 15948 in the Asian trading session today.

    Both the STOCH and STOCHRSI are indicating overbought levels which means that in the immediate short term, a decline in the prices is expected.

    The relative strength index is at 36 indicating a WEAK demand for bitcoin, and the continuation of the selling pressure in the markets.

    Bitcoin is now moving below its 100 hourly simple moving average and below its 200 hourly exponential moving averages.

    Most of the major technical indicators are giving a STRONG SELL signal, which means that in the immediate short term, we are expecting targets of 15500 and 15000.

    The average true range is indicating LESS market volatility with a mildly bearish momentum.

    • Bitcoin: bearish reversal seen below $17110
    • The Williams percent range is indicating an overbought levels
    • The price is now trading just above its pivot level of $15718
    • All of the moving averages are giving a STRONG SELL market signal


    Bitcoin: Bearish Reversal Seen Below $17110


    We can now see that the price of bitcoin is moving in a mildly bearish momentum and we are expecting more downside waves in this week.

    We can see that the support of the channel is broken in the daily time frame indicating bearish trends.

    The price of bitcoin is ranging near a new record low of 1 month and 1 year’s time frame.

    There is a descending channel forming which is expected to break the current support levels of bitcoin at $15716.

    The immediate short-term outlook for bitcoin is strongly bearish, the medium-term outlook has turned bearish, and the long-term outlook remains neutral under present market conditions.

    Bitcoin’s support zone is located at $15516 which is a 1-month and 1-year’s low point.

    The price of BTCUSD is now facing its classic support level of 15583 and Fibonacci support level of 15682 after which the path towards 15500 will get cleared.

    In the last 24hrs BTCUSD has decreased by 2.09% by 334$ and has a 24hr trading volume of USD 33.191 billion. We can see an increase of 12.91% in the trading volume compared to yesterday, which appears to be normal.

    The Week Ahead

    The price of bitcoin is moving near the 1-year low and has already broken the support levels of $15980 which is the last pivot point.

    We can see a bearish trend reversal signal with the moving average MA50 in the 15-minute time frame.

    The daily RSI is printing at 31 which indicates a weaker demand for bitcoin and the continuation of the selling pressure in the markets.

    The price of BTCUSD will need to remain above the important support level of $14688 which is a 3–10-day MACD oscillator stalls.

    The weekly outlook is projected at $15500 with a consolidation zone of $15000.

    The Collapse of FTX

    The cryptocurrency exchange FTX, valued at $26.5 billion last year, collapsed, which sent ripples through the crypto market and became the primary driving force for Bitcoin which is near the record lows of its 1 year.

    FTX faced a liquidity crisis, and in the hours following, experienced a possible hack in which hundreds of millions worth of tokens were stolen.

    FTX filed for bankruptcy on Nov. 11, 2022. The future of FTX as a cryptocurrency exchange is in serious jeopardy. As of mid-November 2022, withdrawals are disabled and a notice on the FTX website says the company “strongly advises against depositing.”

    Technical Indicators:

    The moving averages convergence divergence, MACD (12,26): is at -116.00 indicating a SELL

    The commodity channel index, CCI (14): is at -75.95 indicating a SELL

    The rate of price change, ROC: is at -0.140 indicating a SELL

    Bull/Bear power (13): is at -141.77 indicating a SELL

    VIEW FULL ANALYSIS VISIT - FXOpen Blog...

    Disclaimer: CFDs are complex instruments and come with a high risk of losing your money.

  6. #606
    Junior Member FXOpen Trader's Avatar
    Join Date
    Dec 2020
    Location
    Asia
    Posts
    1,758
    EUR/USD Eyes Fresh Increase While USD/CHF Corrects Lower


    EUR/USD is eyeing a fresh increase above the 1.0320 resistance zone. USD/CHF is correcting gains and might test the 0.9475 support zone.

    Important Takeaways for EUR/USD and USD/CHF

    • The Euro started a fresh decline and tested the 1.0220 support against the US Dollar.
    • There is a major bearish trend line forming with resistance near 1.0315 on the hourly chart of EUR/USD.
    • USD/CHF started a fresh increase after it was able to clear the 0.9500 resistance.
    • There was a break below a key bullish trend line with support near 0.9540 on the hourly chart.


    EUR/USD Technical Analysis

    This week, the Euro started a downside correction from the 1.0400 zone against the US Dollar. The EUR/USD pair declined below the 1.0320 support level to move into a short-term bearish zone.

    The pair even tested the 1.0220 support zone. It traded as low as 1.0222 on FXOpen and recently started a decent increase. There was a move above the 1.0275 level and the 50 hourly simple moving average. The pair even cleared the 50% Fib retracement level of the downward move from the 1.0395 swing high to 1.0222 low.

    EUR/USD Hourly Chart


    An immediate resistance is near the 1.0320 level. There is also a major bearish trend line forming with resistance near 1.0315 on the hourly chart of EUR/USD.

    The 61.8% Fib retracement level of the downward move from the 1.0395 swing high to 1.0222 low is also near 1.0329 to act as resistance. The next major resistance is near the 1.0350 level. A clear move above the 1.0350 resistance zone could set the pace for a larger increase towards 1.0400.

    The next major resistance is near the 1.0500 zone. On the downside, an immediate support is near the 1.0280 level. The next major support is near the 1.0265 level. A downside break below the 1.0265 support could start another decline.

    VIEW FULL ANALYSIS VISIT - FXOpen Blog...

    Disclaimer: CFDs are complex instruments and come with a high risk of losing your money.

  7. #607
    Junior Member FXOpen Trader's Avatar
    Join Date
    Dec 2020
    Location
    Asia
    Posts
    1,758
    TOP-20 most powerful currencies in the world


    According to the United Nations, 180 currencies are legal tender, but when asked what is the strongest currency in the world, what comes to mind? The US dollar, which is strengthening because of the Fed’s hawkish monetary policy stance in response to skyrocketing inflation. Or the euro, despite the International Monetary Fund predicting just 0.5% growth in the European economy in 2023 and warning that “the worst is yet to come” due to the war in Ukraine, record inflation, and the impact of the COVID-19 pandemic. Perhaps the British pound, despite the UK’s challenging domestic picture? You’d be surprised to learn that there are currencies that outperform the trio.

    FXOpen has compiled a list of the world's top-20 currencies in the world as of 2022. Learn which is number one, and which are stronger than USD, EUR, and GBP despite the latters’ title of the most famous, most traded, and most widely spread currencies of the world.

    Trading currencies involves simultaneously buying one currency and selling another, which is known as currency comparison. In the following list, all currencies are quoted against one US dollar.

    VIEW FULL ANALYSIS VISIT - FXOpen Blog...

    Disclaimer: CFDs are complex instruments and come with a high risk of losing your money.

  8. #608
    Junior Member FXOpen Trader's Avatar
    Join Date
    Dec 2020
    Location
    Asia
    Posts
    1,758
    ETHUSD and LTCUSD Technical Analysis – 24th NOV, 2022


    ETHUSD: Bullish Engulfing Pattern Above $1075

    Ethereum was unable to sustain its bullish momentum and after touching a high of 1230 on 20th Nov, the prices started to decline against the US dollar touching a low of 1078 on 22nd Nov.

    After this decline we can see some upwards correction in the levels of Ethereum towards the $1200 handle.

    We can see a three white soldiers pattern in the daily time frame indicating the Bullish trend.

    We can clearly see a bullish engulfing pattern above the $1075 handle which is a bullish pattern and signifies the end of a bearish phase and the start of a bullish phase in the markets.

    ETH is now trading just above its pivot levels of 1201 and moving into a strongly bullish channel. The price of ETHUSD is now testing its classic resistance level of 1205 and Fibonacci resistance level of 1211 after which the path towards 1250 will get cleared.

    The relative strength index is at 62 indicating a STRONG demand for Ether and the continuation of the buying pressure in the markets.

    The Williams percent range is back over -50 in the daily time frame indicating a bullish sentiment.

    The STOCHRSI is indicating an oversold level, which means that the prices are expected to correct upwards in the short-term range.

    Most of the technical indicators are giving a STRONG BUY market signal.

    Most of the moving averages are giving a BUY signal, and we are now looking at the levels of $1250 to $1300 in the short-term range.

    ETH is now trading below its 100 hourly simple and exponential moving averages.

    • Ether: bullish reversal seen above the $1075 mark
    • The short-term range appears to be strongly bullish
    • ETH continues to remain above the $1100 level
    • The average true range is indicating LESS market volatility


    Ether: Bullish Reversal Seen Above $1075


    ETHUSD is now moving into a strongly bullish channel with the price trading above the $1100 handle in the European trading session today.

    ETH continues to correct higher against the US dollar and is expected to stay above the $1200 level.

    ETHUSD touched an intraday low of 1168 in the Asian trading session and an intraday high of 1217 in the European trading session today.

    We can see the formation of both the bullish harami and bullish harami cross pattern in the 1-hour time frame.

    The momentum indicator is back over zero in the 15-minute time frame.

    The resistance of the channel is broken in the 1-hour time frame indicating a bullish trend.

    The daily RSI is printing at 43 indicating a neutral demand for Ether in the long-term range.

    The key support levels to watch are $1185 at which price crosses the 9-day moving average, and $1195 which is a 14-3 day raw stochastic at 20%.

    ETH has increased by 3.00% with a price change of 35.00$ in the past 24hrs and has a trading volume of 11.226 billion USD.

    We can see a decrease of 7.02% in the total trading volume in the last 24 hrs which appears to be normal.

    The Week Ahead

    ETH price continues to remain in a strongly bullish zone against the US dollar and bitcoin. ETHUSD is expected to correct higher towards the $1200 and $1300 levels this week.

    We can see the formation of a major bullish trendline in place from $1075 towards $1234 level.

    The immediate short-term outlook for Ether has turned strongly bullish, the medium-term outlook has turned neutral, and the long-term outlook for Ether is neutral in present market conditions.

    The price of ETHUSD will need to remain above the important support levelsof $1144 which is a 3-10 day MACD oscillator stalls.

    The weekly outlook is projected at $1250 with a consolidation zone of $1200.

    Technical Indicators:

    The relative strength index (14): is at 62.17 indicating a BUY

    The rate of price change: is at 2.80 indicating a BUY

    Bull/bear power (13): is at 8.042 indicating a BUY

    High/lows (14): is at 3.72 indicating a BUY

    VIEW FULL ANALYSIS VISIT - FXOpen Blog...

    Disclaimer: CFDs are complex instruments and come with a high risk of losing your money.

  9. #609
    Junior Member FXOpen Trader's Avatar
    Join Date
    Dec 2020
    Location
    Asia
    Posts
    1,758
    AUD/USD and NZD/USD Could Accelerate Higher


    AUD/USD is moving higher and might accelerate higher above 0.6780. NZD/USD is also rising and might aim more upsides above 0.6300.

    Important Takeaways for AUD/USD and NZD/USD

    • The Aussie Dollar started a fresh increase above the 0.6550 and 0.6640 levels against the US Dollar.
    • There is a key bullish trend line forming with support near 0.6715 on the hourly chart of AUD/USD.
    • NZD/USD is gaining bullish pace above the 0.6250 support zone.
    • There is a major bullish trend line forming with support near 0.6245 on the hourly chart of NZD/USD.


    AUD/USD Technical Analysis

    The Aussie Dollar formed a base above the 0.6560 level and started a fresh increase against the US Dollar. The AUD/USD pair gained pace above the 0.6590 level to move into a positive zone.

    There was a clear move above the 0.6640 level and the 50 hourly simple moving average. The pair even climbed above the 0.6720 level and traded as high as 0.6778. It is now correcting gains and trading below the 0.6770 level.

    AUD/USD Hourly Chart


    On the downside, an initial support is near the 0.6735 level. It is near the 23.6% Fib retracement level of the upward move from the 0.6585 swing low to 0.6778 high.

    The next support could be the 0.6715 level. There is also a key bullish trend line forming with support near 0.6715 on the hourly chart of AUD/USD. If there is a downside break below the 0.6715 support, the pair could extend its decline towards the 0.6680 level.

    It is near the 50% Fib retracement level of the upward move from the 0.6585 swing low to 0.6778 high. On the upside, the AUD/USD pair is facing resistance near the 0.6775 level.

    The next major resistance is near the 0.6800 level. A close above the 0.6800 level could start a steady increase in the near term. The next major resistance could be 0.6920.

    VIEW FULL ANALYSIS VISIT - FXOpen Blog...

    Disclaimer: CFDs are complex instruments and come with a high risk of losing your money.

  10. #610
    Junior Member FXOpen Trader's Avatar
    Join Date
    Dec 2020
    Location
    Asia
    Posts
    1,758
    Watch FXOpen's November 21 - 25 Weekly Market Wrap Video

    In this video, FXOpen UK COO Gary Thomson sums up the week’s happenings and discusses the most significant news reports.

    • Why is gold going up?
    • NZD at 3-month highs
    • COVID outbreak in China, oil finds support
    • Bitcoin hits new year low amid rumors of another high-profile bankruptcy.


    Watch our short and informative video, and stay updated with FXOpen.


    FXOpen YouTube

    Disclaimer: CFDs are complex instruments and come with a high risk of losing your money.

Page 61 of 145 FirstFirst ... 11 51 59 60 61 62 63 71 111 ... LastLast

Bookmarks

Posting Permissions

  • You may not post new threads
  • You may not post replies
  • You may not post attachments
  • You may not edit your posts
  •