Page 55 of 145 FirstFirst ... 5 45 53 54 55 56 57 65 105 ... LastLast
Results 541 to 550 of 1442

Daily Market Analysis By FXOpen

This is a discussion on Daily Market Analysis By FXOpen within the Analytics and News forums, part of the Trading Forum category; ETHUSD and LTCUSD Technical Analysis – 29th SEP, 2022 ETHUSD: Bullish Engulfing Pattern Above $1257 Ethereum was unable to sustain ...


  1. #541
    Junior Member FXOpen Trader's Avatar
    Join Date
    Dec 2020
    Location
    Asia
    Posts
    1,751
    ETHUSD and LTCUSD Technical Analysis – 29th SEP, 2022


    ETHUSD: Bullish Engulfing Pattern Above $1257

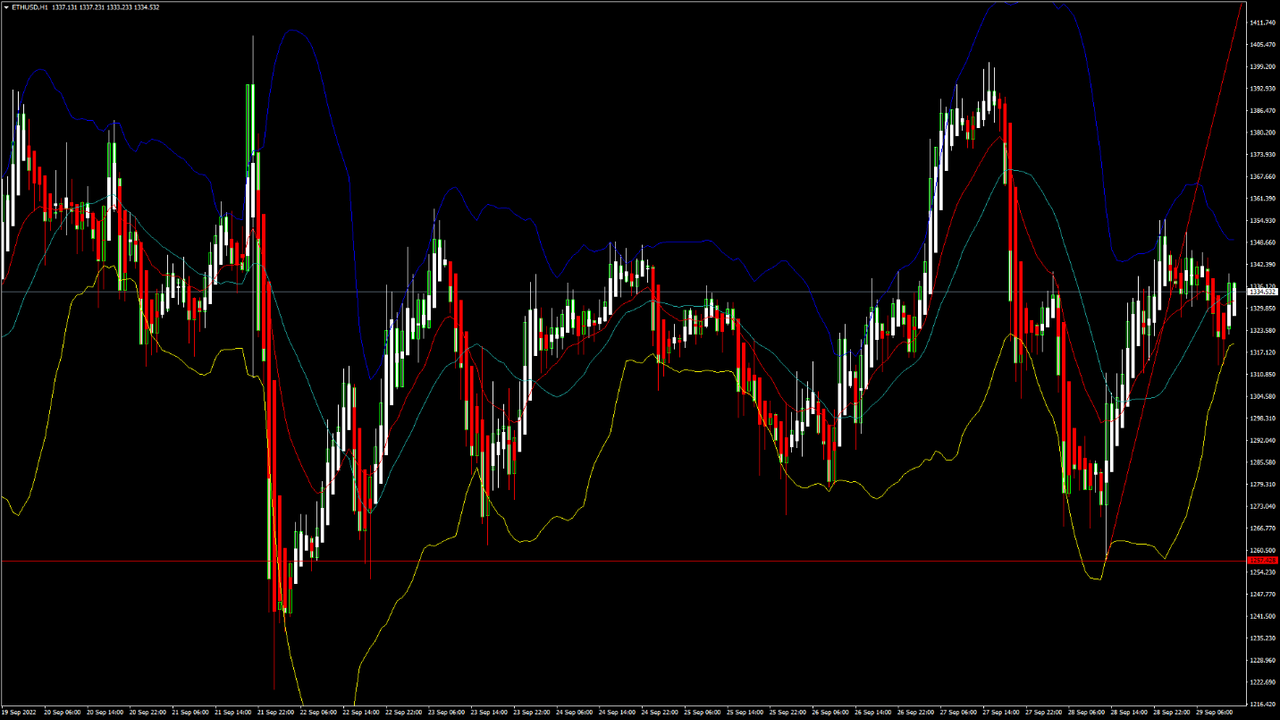
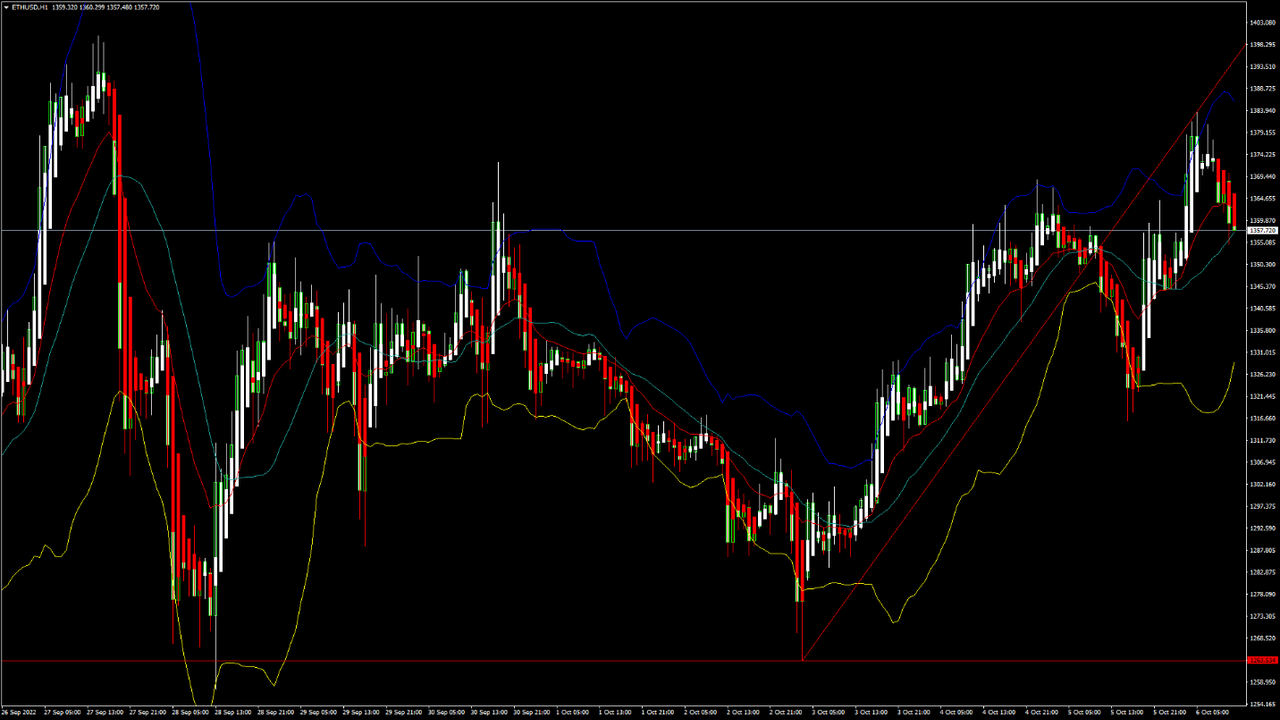
    Ethereum was unable to sustain its bullish momentum and after touching a high of 1400 on 27th Sep the price started to decline against the US dollar. The price of Ethereum touched a low of 1266 on 28th Sep after which we can see a bounce upwards.

    We can see a continued buying pressure today and the formation of a bullish engulfing line in the 2-hour time frame.

    We can clearly see a bullish engulfing pattern above the $1257 handle which is a bullish pattern and signifies the end of a bearish phase and the start of a bullish phase in the markets.

    ETH is now trading just above its pivot level of 1321 and moving into a strong bullish channel. The price of ETHUSD is now testing its сlassic resistance level of 1327 and Fibonacci resistance level of 1331 after which the path towards 1400 will get cleared.

    The relative strength index is at 53 indicating a NEUTRAL demand for Ether and a shift towards the consolidation phase in the markets.

    We can see that the adaptive moving average AMA20, AMA50, and AMA100 are giving a bullish trend reversal signal in the markets.

    The STOCHRSI and Williams percent range is indicating a NEUTRAL market, which means that the prices are expected to remain in a consolidation phase in the short-term range.

    Some of the technical indicators are giving a STRONG BUY market signal.

    Most of the moving averages are giving a BUY signal and we are now looking at the levels of $1400 to $1550 in the short-term range.

    ETH is now trading above both its 100 & 200 hourly simple and exponential moving averages.

    • Ether: bullish reversal seen above the $1257 mark
    • The short-term range appears to be mildly BULLISH
    • ETH continues to remain above the $1300 level
    • The average true range is indicating LESS market volatility


    Ether: Bullish Reversal Seen Above $1257


    ETHUSD is moving in a mildly bullish channel with the price trading above the $1300 handle in the European trading session today.

    ETH touched an intraday high of 1351 in the Asian trading session and an intraday low of 1313 in the European trading session today.

    We have seen that the ichimoku price is over the cloud in the 1-hour time frame indicating a bullish scenario.

    The Bullish harami pattern is observed in the weekly timeframe and MACD indicator is giving a bullish divergence signal in the 4-hour time frame.

    The parabolic SAR indicator is giving a bullish reversal signal in the 30-minute time frame and now we are looking at the levels of 1450 to 1500 in the medium-term range.

    The daily RSI is printing at 40 indicating a neutral demand in the long-term range.

    The key support levels to watch are $1245 and $1285 and the prices of ETHUSD need to remain above these levels for the continuation of the bullish reversal in the markets.

    ETH has increased by 4.27% with a price change of 54.65$ in the past 24hrs and has a trading volume of 16.127 billion USD.

    We can see a decrease of 13.25% in the total trading volume in the last 24 hrs which is due to the shift towards a consolidation phase in the markets.

    The Week Ahead

    The price of Ethereum declined due the ongoing strength of the United States dollar and the increase in the market liquidity. We can see that now we are moving into a consolidation zone and the prices tend to move in a narrow range.

    We are now looking for a fresh upside wave of correction towards the $1500 and $1600 levels.

    We can see the formation of a bullish trendline in place from $1257 towards $1491 level.

    The immediate short-term outlook for Ether has turned mildly BULLISH, the medium-term outlook has turned BULLISH, and the long-term outlook for Ether is NEUTRAL in present market conditions.

    The prices of ETHUSD will need to remain above the important support level of $1250 this week.

    The weekly outlook is projected at $1550 with a consolidation zone of $1500.

    Technical Indicators:

    The average directional change (14): is at 25.71 indicating a BUY

    The rate of price change: is at 0.156 indicating a BUY

    The bull/bear power (13): is at 1.606 indicating a BUY

    The ultimate oscillator: is at 56.76 indicating a BUY

    VIEW FULL ANALYSIS VISIT - FXOpen Blog...

    Disclaimer: CFDs are complex instruments and come with a high risk of losing your money.

  2. #542
    Junior Member FXOpen Trader's Avatar
    Join Date
    Dec 2020
    Location
    Asia
    Posts
    1,751
    Gold Price and Crude Oil Price Could Gain Bullish Momentum


    Gold price started a recovery wave from the $1,615 level. Crude oil price could gain bullish momentum if it clears the $82.50 resistance zone.

    Important Takeaways for Gold and Oil

    • Gold price found support near $1,615 and started a recovery wave against the US Dollar.
    • There was a break above a key bearish trend line with resistance near $1,658 on the hourly chart of gold.
    • Crude oil price also started a recovery wave from the $76.00 zone.
    • There is a major bearish trend line forming with resistance near $81.75 on the hourly chart of XTI/USD.


    Gold Price Technical Analysis


    Gold price declined heavily below the $1,700 level against the US Dollar. The price gained bearish momentum and declined below the $1,680 level.

    There was a clear move below the $1,650 support zone and the 50 hourly simple moving average. The price traded as low as $1,615 and recently there was a recovery wave. The price was able to clear the $1,625 resistance zone.

    There was a move above the 50% Fib retracement level of the downward move from the $1,687 swing high to $1,615 low. There was also a break above a key bearish trend line with resistance near $1,658 on the hourly chart of gold.

    The price of XAU/USD is now trading above the 61.8% Fib retracement level of the downward move from the $1,687 swing high to $1,615 low.

    On the upside, the price is facing resistance near the $1,670 level. The first major resistance is near the $1,680 level. The main resistance is now forming near the $1,688 level, above which it could even test $1,700.

    A clear upside break above the $1,700 resistance could send the price towards $1,720. An immediate support on the downside is near the $1,655 level. The next major support is near the $1,650 level, below which there is a risk of a larger decline. In the stated case, the price could decline sharply towards the $1,620 support zone.

    VIEW FULL ANALYSIS VISIT - FXOpen Blog...

    Disclaimer: CFDs are complex instruments and come with a high risk of losing your money.

  3. #543
    Junior Member FXOpen Trader's Avatar
    Join Date
    Dec 2020
    Location
    Asia
    Posts
    1,751
    UK Government ditches high-earner tax rate cut; Pound freefall halted for the moment


    The British Pound's tremendous freefall has been staggering viewing over the past few weeks. Just when it looked like it would not fall lower, a sudden further drop ensued, bringing the Pound to almost parity with the US Dollar and creating a degree of speculation that perhaps the US Dollar, given its remarkable recent strength, would overtake the Pound and replace it as the world's most valuable currency.

    This has not yet happened, and today as the week's trading begins, the British Pound has made a very slight step in the upward direction, albeit still at very low values compared to its high points six months ago.

    As the London market opened this morning, the Pound had risen by 0.7% to US1.2453 and 0.20% to EUR0.982.

    It is being considered that new further tax cuts which are being expected to be released by Prime Minister Liz Truss in which the highest tax rate, 45%, which is applied to higher earners in the UK, presented a serious risk to the economy, and had been met with great unpopularity by the electorate.

    Today, the government announced that it would not proceed with the tax cuts, and that the high rate of tax will remain at 45%, which has gone some way toward curtailing the freefall that the British economy has been in for some months now.

    The new government has been criticized for potentially assisting 'the rich' whilst the majority of small businesses and private individuals in the country struggle against extremely difficult economic circumstances.

    It is of course easy for those saddled with a 45% tax burden to disagree with the way that the current government has been spending their tax, however in terms of actual percentage of taxable income, it is unlikely that keeping the high rate at 45% will cause a 'brain drain' - that being a term for highly educated, high earners to consider leaving the country.

    This is largely because any other Western country which provides a lifestyle as good as that in the United Kingdom will likely have similar tax rates, therefore not much advantage would be gained.

    Whilst the Pound's dramatic fall in value appears to have slowed, the FTSE 100 is now in the sights of observers. It is expected to open lower today following heavy losses in the US on Friday and with ongoing nervousness about the state of the UK finances.

    There is no doubt that just keeping the top tax rate at 45% is not going to resolve the serious situation that the British economy is in.

    Stocks listed on the FTSE 100 are large, blue-chip companies with vast shareholder bases, and their ability to perform well on their home market is a critical measure of investor confidence and equally a measure of the overall condition of British industry.

    At the moment, housebuilders and financial services firms are down, whereas raw materials miners are up.

    VIEW FULL ANALYSIS VISIT - FXOpen Blog...

    Disclaimer: CFDs are complex instruments and come with a high risk of losing your money.

  4. #544
    Junior Member FXOpen Trader's Avatar
    Join Date
    Dec 2020
    Location
    Asia
    Posts
    1,751
    GBP/USD Eyes Steady Recovery, EUR/GBP Faces Hurdle


    GBP/USD started a recovery wave from a new low at 1.0341 and climbed above 1.1000. EUR/GBP is now facing a major resistance near 0.8870.

    Important Takeaways for GBP/USD and EUR/GBP

    • The British Pound started a fresh recovery wave above the 1.0920 resistance zone against the US Dollar.
    • There was a break above a couple of bearish trend lines at 1.0700 and 1.0800 on the hourly chart of GBP/USD.
    • EUR/GBP started a sharp decline and traded below the 0.8900 level.
    • There is a major bearish trend line forming with resistance near 0.8830 on the hourly chart.


    GBP/USD Technical Analysis


    The British Pound found support near the 1.0340 zone against the US Dollar. The GBP/USD pair started a recovery wave and was able to clear the 1.0650 resistance zone.

    There was a decent increase above the 1.0920 level and the 50 hourly simple moving average. The pair even climbed above the 1.1100 level. During the increase, there was a break above a couple of bearish trend lines at 1.0700 and 1.0800 on the hourly chart of GBP/USD.

    A high was formed near 1.1234 on FXOpen and the pair is now correcting gains. On the downside, an initial support is near the 1.1070 level. It is near the 23.6% Fib retracement level of the upward move from the 1.0540 swing low to 1.1234 high.

    The next major support is near the 1.0880 level. It is near the 50% Fib retracement level of the upward move from the 1.0540 swing low to 1.1234 high. Any more losses could lead the pair towards the 1.0750 support zone or even 1.0680.

    On the upside, an initial resistance is near the 1.1230 level. The next main resistance is near the 1.1300 zone. A clear upside break above the 1.1300 and 1.1310 resistance levels could open the doors for a steady increase in the near term. The next major resistance sits near the 1.1500 level.

    VIEW FULL ANALYSIS VISIT - FXOpen Blog...

    Disclaimer: CFDs are complex instruments and come with a high risk of losing your money.

  5. #545
    Junior Member FXOpen Trader's Avatar
    Join Date
    Dec 2020
    Location
    Asia
    Posts
    1,751
    Tesla in the doldrums as Elon Musk offers political advice


    Tesla stock is one of the more volatile among big-cap publicly listed corporations, and the last day's performance has demonstrated once again that there is still a lot of uncertainty with regard to its values.

    Tesla stock fell over 8.6% in value during yesterday's New York trading session, adding a further downturn to the 14.6% it has lost over the five day moving average.

    Opinions vary on what caused this particular collapse in value, however it did coincide with reports that the company's record delivery figures for its electric cars had shown how challenging it can be to secure vehicle transportation capacity and at a reasonable cost, but surely there must be more to it than that?

    Record deliveries of a product which is manufactured by a publicly listed company with shareholders to please usually brings confidence and Tesla's revolutionization of the entire automotive industry toward electric vehicles plus its standing as a huge market contender globally should go along with these record delivery figures nicely.

    But it didn't.

    Some dissenters consider that the entry level Tesla models such as the Model 3 and Model Y are quite simply not premium products, and despite their pricetag, are not much more well equipped or better engineered than budget cars from established brands in Europe and Asia at less than half the cost, giving rise to a possible feeling of marketing over substance.

    That still wouldn't be enough to create such a downturn in share price though, because the cars are selling in high numbers and the revenues are pouring in more than ever.

    Increased operating costs are one perhaps interesting area to examine. An expert in balancing the books, rival car manufacturer Ford Motor Company, recently said that inflation-related costs would be $1 billion more than expected in the third quarter and that parts shortages had delayed deliveries.

    However, it may well be Elon Musk's tendency to go down the political path in the public arena that has had some effect.

    Yesterday, Elon Musk said that, in the current geopolitical conflict, UN-supervised elections in four occupied regions that Moscow has falsely annexed after what it called referendums. "Russia leaves if it is the will of the people" he said, prompting a Twitter response from Ukrainian President Volodymyr Zelensky.

    Politics and business often do not mix, and the more conservative investors often take a dim view of involvement in such situations which can create commercial risk.

    Elon Musk is no stranger to that, of course, and has in the past caused crashes and booms by taking to Twitter to voice his opinion!

    VIEW FULL ANALYSIS VISIT - FXOpen Blog...

    Disclaimer: CFDs are complex instruments and come with a high risk of losing your money.

  6. #546
    Junior Member FXOpen Trader's Avatar
    Join Date
    Dec 2020
    Location
    Asia
    Posts
    1,751
    BTCUSD and XRPUSD Technical Analysis – 04th OCT 2022


    BTCUSD: Three White Soldiers Pattern Above $18527

    Bitcoin was unable to sustain its bullish momentum and after touching a high of 20328 on 27th Sep, it started to decline touching a low of 18525 on 28th Sep. After this decline, the prices have stabilized and we can see an uptrend in the markets.

    The prices have crossed the $20000 mark in the European trading session today.

    We can see that the price is back over the pivot point in the weekly time frame.

    The price of bitcoin is ranging near the horizontal support levels in the weekly time frame.

    We can clearly see a three white soldiers pattern above the $18527 handle which is a bullish reversal pattern because it signifies the end of a downtrend and a shift towards an uptrend.

    Bitcoin touched an intraday low of 19510 in the Asian trading session and an intraday high of 20099 in the European trading session today.

    Both the STOCH and STOCHRSI are indicating overbought levels which means that in the immediate short term a decline in the prices is expected.

    The relative strength index is at 74 indicating a STRONG demand for bitcoin, and the continuation of the buying pressure in the markets.

    Bitcoin is now moving above its 100 hourly simple moving average and above its 200 hourly exponential moving averages.

    Most of the major technical indicators are giving a STRONG BUY signal, which means that in the immediate short term we are expecting targets of 21000 and 22500.

    The average true range is indicating LESS market volatility with a strong bullish momentum.

    • Bitcoin: bullish reversal seen above $18527
    • The Williams percent range is indicating an overbought level
    • The price is now trading just above its pivot level of $19931
    • All of the moving averages are giving a STRONG BUY market signal


    Bitcoin: Bullish Reversal Seen Above $18527


    The strong bullish rebound that is seen is expected to continue in the short-term range and now we are looking at $21000 and $22000 as the immediate targets.

    The adaptive moving average AMA20 is giving a bullish crossover pattern in the daily timeframe.

    The parabolic SAR indicator is giving a bullish reversal signal on the daily time frame.

    We have also detected the ichimoku bullish crossover pattern on the 4-hour time frame.

    The immediate short-term outlook for bitcoin is bullish, the medium-term outlook has turned bullish, and the long-term outlook remains neutral under present market conditions.

    Bitcoin’s support zone is located at $19005 and the prices continue to remain above this level for the continuation of the bullish reversal in the markets.

    The price of BTCUSD is now facing its classic resistance level of 20007 and Fibonacci resistance level of 200048 after which the path towards 21000 will get cleared.

    In the last 24hrs, BTCUSD has increased by 3.80% by 730$, and has a 24hr trading volume of USD 31.762 billion. We can see an increase of 28.33% in the trading volume as compared to yesterday, due to increased demand for bitcoin globally.

    The Week Ahead

    The prices of bitcoin are moving in a bullish zone above the $19900 level. Further upsides are projected at $21000 and $22000 as the immediate targets.

    We have seen continued buying pressure at lower levels, as we can see the formation of an ascending price channel from $18527 towards the $20214 levels.

    The daily RSI is printing at 52 which indicates a neutral level and a move towards the consolidation phase in the markets.

    The price of BTCUSD will need to remain above the important support level of $19000 this week.

    The weekly outlook is projected at $21000 with a consolidation zone of $20500.

    Technical Indicators:

    The moving averages convergence divergence (12,26): is at 142.70 indicating a BUY

    The ultimate oscillator: is at 60.39 indicating a BUY

    The rate of price change: is at 1.75 indicating a BUY

    The average directional change (14): is at 52.40 indicating a BUY

    VIEW FULL ANALYSIS VISIT - FXOpen Blog...

    Disclaimer: CFDs are complex instruments and come with a high risk of losing your money.

  7. #547
    Junior Member FXOpen Trader's Avatar
    Join Date
    Dec 2020
    Location
    Asia
    Posts
    1,751
    EUR/USD Recovers Ground, USD/JPY Could Resume Uptrend


    EUR/USD started a decent recovery wave above the 0.9900 resistance zone. USD/JPY is rising and might soon clear the key 145.00 resistance zone.

    Important Takeaways for EUR/USD and USD/JPY

    • The Euro formed a base and started a decent recovery wave above the 0.9800 zone.
    • There is a major bullish trend line forming with support near 0.9910 on the hourly chart of EUR/USD.
    • USD/JPY declined sharply before it found support near the 143.50 level.
    • There was a break below a key bullish trend line with support near 144.55 on the hourly chart.


    EUR/USD Technical Analysis


    This past week, the Euro found support near the 0.9550 zone against the US Dollar. The EUR/USD pair started a steady recovery wave above the 0.9600 and 0.9680 resistance levels.

    There was a steady increase above the 0.9800 resistance zone and the 50 hourly simple moving average. The pair even climbed above the 0.9900 resistance zone. A high was formed near 0.9998 on FXOpen and the pair is now correcting lower.

    An initial support on the downside is near the 0.9940 level. It is near the 23.6% Fib retracement level of the upward move from the 0.9754 swing low to 0.9998 high.

    The first major support is near the 0.9920 level. There is also a major bullish trend line forming with support near 0.9910 on the hourly chart of EUR/USD. The main support sits near the 0.9880 zone. It is near the 50% Fib retracement level of the upward move from the 0.9754 swing low to 0.9998 high.

    An immediate resistance on the upside is near the 1.0000 level. The next major resistance is near the 1.0050 level. An upside break above 1.0050 could set the pace for another increase. In the stated case, the pair might revisit 1.0150. Any more gains might send the pair towards 1.0200.

    VIEW FULL ANALYSIS VISIT - FXOpen Blog...

    Disclaimer: CFDs are complex instruments and come with a high risk of losing your money.

  8. #548
    Junior Member FXOpen Trader's Avatar
    Join Date
    Dec 2020
    Location
    Asia
    Posts
    1,751
    Twitter and Tesla volatility as Elon Musk dumps stock to fund his purchase


    In today's age of influencers, there is one figure who can possibly lay claim to being the influencer of all influencers, and that is Elon Musk.

    Known for making extremely forthright decisions and taking a leading position in, well, pretty much everything he does, what often appear to be vanity projects for self-promotion end up being sound business moves which disrupt entire industry sectors and lead to massive returns.

    A case in point is last year's almost unbelievable scenario in which a tweet put out by Elon Musk crashed the value of five popular cryptocurrencies by almost $1 trillion, and instead of scaring people off in their droves, a large number of conservative, analytical investors bought in, and then a few weeks later a subsequent tweet by Elon Musk caused the values to rise again.

    This fascinating working of the media by one man has become one of his trademarks, so much so that Elon Musk has been attempting to acquire Twitter for a few months now.

    Just as he appeared to have given up, his interest in buying Twitter has resurfaced, and once again he is dumping shares in Tesla to be able to fund the purchase of it.

    Back in April 14 this year, Elon Musk made his initial offer to purchase Twitter for $43 billion, after previously acquiring 9.1% of the company's stock for $2.64 billion. To do this, he leveraged some of his positions at Tesla and made loans, however the deal fell through.

    Now it appears that the deal is back on the table and Elon Musk is back in the business of offloading Twitter stock in order to buy Twitter on the open market, a move that has been criticized by many traditional investors and wealth managers.

    One comment, coming from Wedbush Securities' Dan Ives yesteday was particularly harsh. "Selling Tesla stocks to fund his Twitter takeover is like giving away caviar to buy $2 pizza" said Mr. Ives.

    Tesla stock has been declining in value for a number of weeks, and yesterday's move was no exception. The market reacted to Elon Musk's renewed interest in Twitter with a downward move for Twitter of a further 3.4% on the US market yesterday.

    Twitter stock, however, jumped up in value from 50.85 USD at the beginning of the trading session to 51.81 by lunchtime yesterday, showing that investors welcomed the news.

    In keeping with Elon Musk's gung-ho approach, there is much volatility now in both stocks and it sometimes appears as though he enjoys this sort of market pandemoneum, hence his continued appetite for causing it!

    VIEW FULL ANALYSIS VISIT - FXOpen Blog...

    Disclaimer: CFDs are complex instruments and come with a high risk of losing your money.

  9. #549
    Junior Member FXOpen Trader's Avatar
    Join Date
    Dec 2020
    Location
    Asia
    Posts
    1,751
    ETHUSD and LTCUSD Technical Analysis – 06th OCT, 2022


    ETHUSD: Hammer Pattern Above $1263

    Ethereum was unable to sustain its bullish momentum and after touching a high of 1372 on 30th Sep the prices started to decline against the US dollar. The prices of Ethereum touched a low of 1269 on 03rd Oct after which we can see a bounce upwards.

    We can see the formation of an ascending channel pattern above the 1289 level and are looking at immediate targets of 1410 and 1469.

    We can clearly see a hammer pattern above the $1263 handle which is a bullish pattern and signifies the end of a bearish phase and the start of a bullish phase in the markets.

    ETH is now trading just above its pivot level of 1366 and is moving into a mildly bullish channel. The price of ETHUSD is now testing its classic resistance level of 1370 and Fibonacci resistance level of 1372 after which the path towards 1400 will get cleared.

    The relative strength index is at 51 indicating a NEUTRAL demand for Ether and the shift towards the consolidation phase in the markets.

    We can see that the adaptive moving average AMA50 is giving a bullish price crossover pattern in the 15-minute time frame.

    The commodity channel index, CCI, and the average directional index, ADX, are indicating a NEUTRAL market, which means that the prices are expected to remain in a consolidation phase in the short-term range.

    Some of the technical indicators are giving a BUY market signal.

    Some of the moving averages are giving a BUY signal and we are now looking at the levels of $1400 to $1500 in the short-term range.

    ETH is now trading above both its 100 & 200 hourly simple and exponential moving averages.

    • Ether: bullish reversal seen above the $1263 mark
    • Short-term range appears to be mildly BULLISH
    • ETH continues to remain above the $1300 level
    • The average true range is indicating LESS market volatility


    Ether: Bullish Reversal Seen Above $1263


    ETHUSD is now moving into a mildly bullish channel with the price trading above the $1300 handle in the European trading session today.

    ETH touched an intraday low of 1345 in the Asian trading session and an intraday high of 1383 in the European trading session today.

    We can see the formation of both the bullish harami and bullish harami cross pattern in the 15-minute time frame.

    The three white soldiers pattern is visible in the 15-minute time frame indicating a bullish scenario.

    We have seen a bullish opening of the markets which is indicative of the ongoing bullish trend.

    The daily RSI is printing at 45 indicating a neutral demand in the long-term range.

    The key support levels to watch are $1227 and $1276, and the price of ETHUSD needs to remain above these levels for the continuation of the bullish reversal in the markets.

    ETH has increased by 1.11% with a price change of 14.93$ in the past 24hrs and has a trading volume of 11.464 billion USD.

    We can see an increase of 25.95% in the total trading volume in the last 24 hrs which appears to be normal.

    The Week Ahead

    The price of Ethereum continues to find support at lower levels and we can see an upside correction towards the $1400 level.

    Ethereum’s price has now entered the bullish zone against the US dollar and we are now moving towards the $1500 level.

    We can see the formation of a bullish trend line in place from $1263 towards $1409 levels.

    The immediate short-term outlook for Ether has turned mildly BULLISH, the medium-term outlook has turned BULLISH, and the long-term outlook for Ether is NEUTRAL in present market conditions.

    The price of ETHUSD will need to remain above the important support level of $1223 this week.

    The weekly outlook is projected at $1475 with a consolidation zone of $1450.

    Technical Indicators:

    The Williams percent range: is at -28.54 indicating a BUY

    The rate of price change: is at 4.33 indicating a BUY

    Bull/Bear power (13): is at 33.63 indicating a BUY

    The STOCHRSI (14): is at 57.13 indicating a BUY

    VIEW FULL ANALYSIS VISIT - FXOpen Blog...

    Disclaimer: CFDs are complex instruments and come with a high risk of losing your money.

  10. #550
    Junior Member FXOpen Trader's Avatar
    Join Date
    Dec 2020
    Location
    Asia
    Posts
    1,751
    Watch FXOpen's October 3-7 Weekly Digest Video

    In this video, FXOpen UK COO Gary Thomson sums up the week’s happenings and discusses the most significant news reports.

    • GBP/USD eyes steady recovery, EUR/GBP faces hurdle
    • Dollar bounces back after record fall
    • Oil is getting more expensive. What's next?
    • Twitter and Tesla volatility as Elon Musk dumps stock to fund his purchase


    Watch our short and informative video, and stay updated with FXOpen.


    FXOpen YouTube

    Disclaimer: CFDs are complex instruments and come with a high risk of losing your money.

Page 55 of 145 FirstFirst ... 5 45 53 54 55 56 57 65 105 ... LastLast

Bookmarks

Posting Permissions

  • You may not post new threads
  • You may not post replies
  • You may not post attachments
  • You may not edit your posts
  •