Page 49 of 145 FirstFirst ... 39 47 48 49 50 51 59 99 ... LastLast
Results 481 to 490 of 1441

Daily Market Analysis By FXOpen

This is a discussion on Daily Market Analysis By FXOpen within the Analytics and News forums, part of the Trading Forum category; GBP/USD Eyes More Gains, EUR/GBP Could Correct Higher GBP/USD started a fresh increase above the 1.2000 zone. EUR/GBP might attempt ...


  1. #481
    Junior Member FXOpen Trader's Avatar
    Join Date
    Dec 2020
    Location
    Asia
    Posts
    1,750
    GBP/USD Eyes More Gains, EUR/GBP Could Correct Higher


    GBP/USD started a fresh increase above the 1.2000 zone. EUR/GBP might attempt a recovery wave if it clears the 0.8430 resistance.

    Important Takeaways for GBP/USD and EUR/GBP

    • The British Pound started a fresh increase from the 1.1850 zone against the US Dollar.
    • There is a key bullish trend line forming with support near 1.2120 on the hourly chart of GBP/USD.
    • EUR/GBP declined below the 0.8450 and 0.8400 support levels .
    • There was a break above a major bearish trend line with resistance near 0.8385 on the hourly chart.


    GBP/USD Technical Analysis

    The British Pound formed base above the 1.1850 and 1.1880 levels against the US Dollar. The GBP/USD pair started a fresh increase after it clearly broke the 1.2000 resistance.

    There was a steady move above the 1.2050 level and the 50 hourly simple moving average. The bulls even pumped the pair above the 1.2120 level. A high was formed near 1.2245 on FXOpen the pair is now consolidating gains.

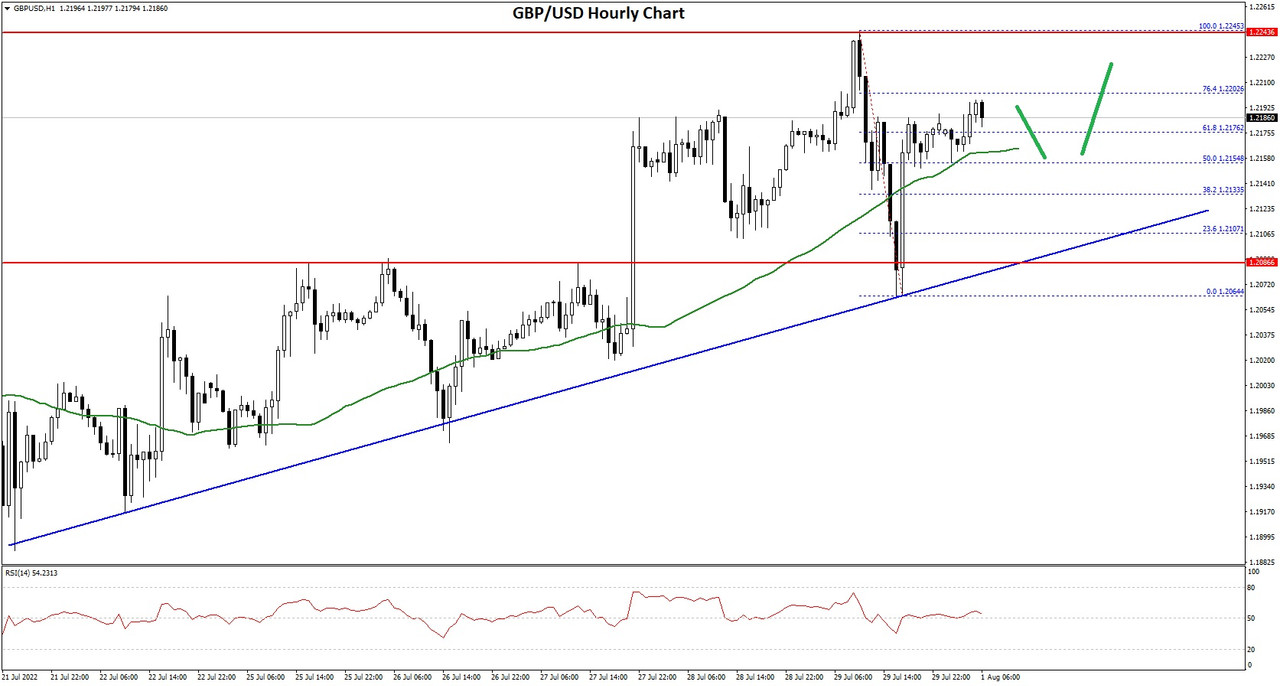
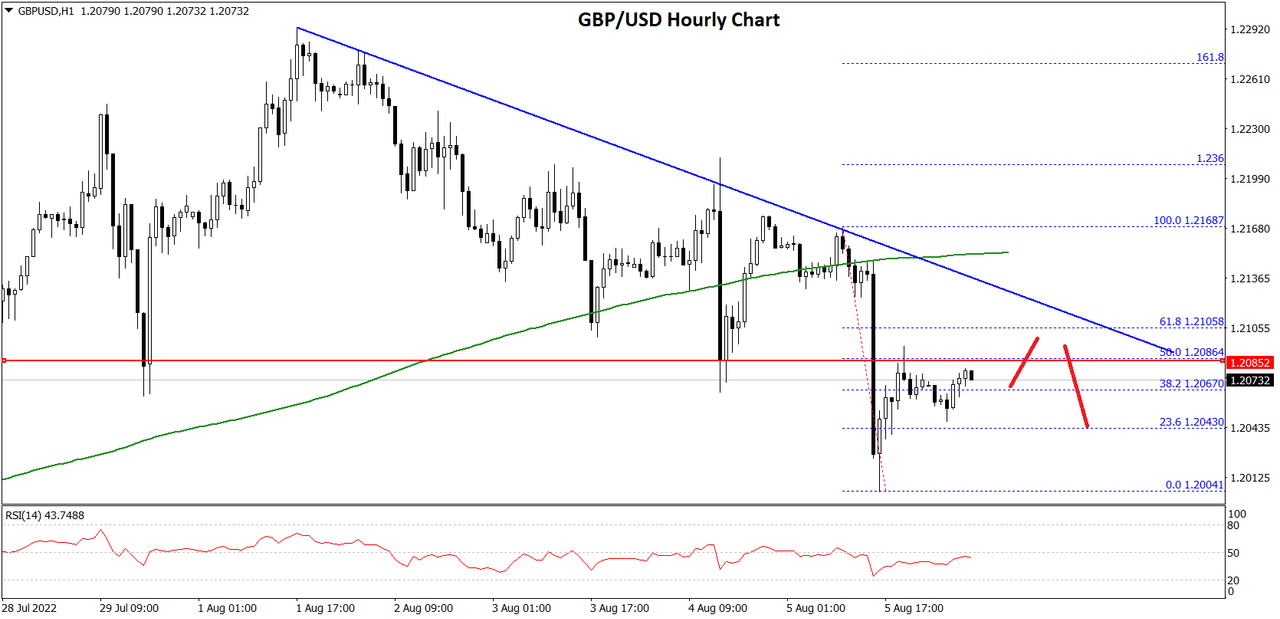
    GBP/USD Hourly Chart


    There was a minor decline below 1.2120, but the bulls were active near 1.2065. There is also a key bullish trend line forming with support near 1.2120 on the hourly chart of GBP/USD.

    The pair is now rising and broke the 50% Fib retracement level of the downward move from the 1.2245 swing high to 1.2064 low. There was a steady increase above the 1.2150 level and the 50 hourly simple moving average.

    On the upside, an initial resistance is near the 1.2195 level. The next main resistance is near the 1.2200 zone. It is near the 76.4% Fib retracement level of the downward move from the 1.2245 swing high to 1.2064 low.

    A clear upside break above the 1.2200 and 1.2210 resistance levels could open the doors for a steady increase in the near term. The next major resistance sits near the 1.2250 level.

    If not, the pair might start a fresh decline below 1.2150. The next major support is near the 1.2120 level. Any more losses could lead the pair towards the 1.2065 support zone or even 1.2000.

    VIEW FULL ANALYSIS VISIT - FXOpen Blog

  2. #482
    Junior Member FXOpen Trader's Avatar
    Join Date
    Dec 2020
    Location
    Asia
    Posts
    1,750
    BTCUSD and XRPUSD Technical Analysis – 02nd AUG 2022


    BTCUSD: Evening Star Pattern Below $24607

    Bitcoin was unable to sustain its bullish momentum and after touching a high of 24597 on 30th July started to decline against the US dollar dropping below the $2300 handle in the European trading session today.

    We can see that after this decline the prices have entered into a consolidation zone above the $22500 handle.

    The prices have started to move in a descending trend channel due to the decrease in the demand and the continued selling across the global crypto markets.

    We can clearly see a bearish evening star pattern below the $24607 handle which is a bearish reversal pattern because it signifies the end of an uptrend and a shift towards a downtrend.

    Bitcoin touched an intraday high of 23438 in the Asian trading session and an intraday low of 22670 in the European trading session today.

    Both the STOCH and Williams percent range are indicating overbought levels which means that in the immediate short term, a decline in the prices is expected.

    The relative strength index is at 37 indicating a weaker demand for bitcoin at the current market levels and the continuation of the selling pressure in the markets.

    Bitcoin is now moving below its 100 hourly simple moving average and its 200 hourly simple moving averages.

    Most of the major technical indicators are giving a strong sell signal, which means that in the immediate short term, we are expecting targets of 22000 and 21500.

    The average true range is indicating lesser market volatility with a bearish momentum.

    • Bitcoin: bearish reversal seen below $24607
    • STOCHRSI is indicating an oversold level
    • The price is now trading just above its pivot level of $22747
    • All of the moving averages are giving a strong sell market signal


    Bitcoin: Bearish Reversal Seen Below $24607


    The price of bitcoin continues to decline below the $23000 handle, and we are now testing the important support level of $22000 in the European trading session.

    The global sentiments continue to remain weak and we can see more downwards correction this week towards the $21500 level.

    Bitcoin was unable to clear its resistance zone located at $25000, and now we can see a progression of the bearish bias in the markets.

    We can see the formation of a bearish harami pattern in the weekly time frame indicating the underlying bearish nature of the markets.

    The immediate short-term outlook for bitcoin is bearish, the medium-term outlook has turned neutral, and the long-term outlook remains neutral under present market conditions.

    Bitcoin’s support zone is located at $21000, and the prices continue to remain above these levels for any potential bullish reversal in the markets.

    The price of BTCUSD is now facing its classic support level of 22500 and Fibonacci resistance levels of 22687 after which the path towards 2000 will get cleared.

    In the last 24hrs, BTCUSD has declined by 1.70% by 394$, and has a 24hr trading volume of USD 27.922 billion. We can see an increase of 20.09% in the trading volume as compared to yesterday, which is due to the selling seen by the short-term investors.

    The Week Ahead

    The price of bitcoin is moving in a mildly bearish momentum, and the immediate targets are $22000 and $21500

    The daily RSI is printing at 52 which indicates a neutral market and the move towards the consolidation channel.

    The trendline formation is seen from the $24600 level towards $22600 indicating that if this bearish trend line gets exhausted, we may see an upwards correction in the prices.

    Bitcoin’s price may continue to remain in a range-bound movement between the $22000 and $23000 levels this week.

    The prices of BTCUSD will need to remain above the important support level of $21000 this week.

    The weekly outlook is projected at $22000 with a consolidation zone of $21000.

    Technical Indicators:

    The average directional change (14 days): at 27.18 indicating a SELL

    The rate of price change: at -1.38 indicating a SELL

    The relative strength index (14): at 38.82 indicating a SELL

    The commodity channel index (14 days): at -91.53 indicating a SELL

    VIEW FULL ANALYSIS VISIT - FXOpen Blog

  3. #483
    Junior Member FXOpen Trader's Avatar
    Join Date
    Dec 2020
    Location
    Asia
    Posts
    1,750
    EUR/USD and USD/JPY At Risk of Additional Losses


    EUR/USD started another decline from the 1.0300 resistance. USD/JPY is declining and might continue to move down below 137.00.

    Important Takeaways for EUR/USD and USD/JPY

    • The Euro started a fresh decline and even traded below the 1.0200 support.
    • There was a break below a key bullish trend line with support near 1.0205 on the hourly chart of EUR/USD.
    • USD/JPY declined heavily from the 139.00 resistance zone.
    • There was a break below a major bullish trend line with support near 136.30 on the hourly chart.


    EUR/USD Technical Analysis

    This week, the Euro started a fresh decline from well above the 1.0280 level against the US Dollar. The EUR/USD pair declined below the 1.0250 and 1.0220 support levels.

    The bears even pushed the pair below the 1.0200 level. There was a close below 1.0200 and the 50 hourly simple moving average. The bears pushed the pair below the 50% Fib retracement level of the upward move from the 1.0097 swing low to 1.0293 high.

    EUR/USD Hourly Chart


    Besides, there was a break below a key bullish trend line with support near 1.0205 on the hourly chart of EUR/USD. An immediate resistance on the upside is near the 1.0200 level.

    The next major resistance is near the 1.0225 level and the 50 hourly simple moving average. An upside break above 1.0225 could set the pace for a steady increase. In the stated case, the pair might revisit 1.0280.

    If not, the pair might drop and test the 1.0165 support. The next major support is near 1.0145 or the 76.4% Fib retracement level of the upward move from the 1.0097 swing low to 1.0293 high, below which the pair could drop to 1.0100 in the near term.

    VIEW FULL ANALYSIS VISIT - FXOpen Blog

  4. #484
    Junior Member FXOpen Trader's Avatar
    Join Date
    Dec 2020
    Location
    Asia
    Posts
    1,750
    Turkish Lira crisis hits corporate borrowers


    The ongoing crisis that has been affecting the Turkish Lira for several months is showing no sign of giving way, and the country's astonishing inflation rate of over 70% is testimony to the dire situation that the nation's economy is facing.

    Turkey is an industrial and commercial powerhouse in the Middle East, and is home to the most developed and diversified industry base in the region, however whilst the productivity and quality of product are both high, and the work ethic is still being clearly demonstrated in a nation which has been open for business during times when others were less so, the Lira and its inflationary backdrop are a massive bugbear.

    The US Dollar, along with all other major currencies, has continued to rise significantly against the Turkish Lira, and today's value for the USDTRY is 17.94.

    Turkish companies which conduct business on an international basis have been faced with the volatility of Forex transactions when settling accounts with their partners and clients, and the continued decline in value of the Turkish Lira has landed them with a conundrum.

    Yesterday the Turkish media reported that companies are borrowing in Lira partly to pay off their debts in foreign currency, and many companies in Turkey have used an average of around 30 Lira out of every 100 Lira borrowed from banks to settle their debts in US Dollars and Euros.

    The sustained losses that the Turkish Lira has made against all major currencies over the past year has caused a dramatic increase in servicing the repayments of foreign debt for Turkish businesses, and this is how it is being addressed.

    At the end of June, the Turkish government announced a ban on loans in Lira to companies holding what it deemed to be too much foreign currency.

    This caused the Lira to whipsaw, a term referring to price movements in a volatile market when a stock or currency price will suddenly switch direction.

    By June 27 the Lira made an unusual gain of approximately 8% gain in two days, trading at 16.01 to the US Dollar, up from the day before the announcement where it closed at 17.35.

    But by late afternoon on the following Monday, it had pared some of those gains, decreasing slightly to 16.5 against the dollar, after whipsawing within the 16 to 17 lira per dollar range.

    Clearly volatility is still rampant, however the switch toward using Lira to repay debt in overseas currencies could be a potential method of circulating the Lira more vigorously which may go some way toward helping it slow its downward spiral.

    Currently, however, it is an uncertain market with an almost year-long record of a downward spiral.

    VIEW FULL ANALYSIS VISIT - FXOpen Blog

  5. #485
    Junior Member FXOpen Trader's Avatar
    Join Date
    Dec 2020
    Location
    Asia
    Posts
    1,750
    ETHUSD and LTCUSD Technical Analysis – 04th AUG, 2022


    ETHUSD – Three Inside Down Pattern Below $1783

    Ethereum was unable to sustain its bullish momentum and after touching a high of 1762 on 30th July started to decline against the US Dollar coming down below the $1600 handle on 02nd Aug.
    The selloff that we saw was due to the strength of the US Dollar and its subsequent effect on the prices of the ETHUSD.
    We can clearly see a Three Inside Down Pattern Below the $1783 handle which is a Bearish pattern and signifies the end of a Bullish phase and the start of a Bearish phase in the markets.
    ETH is now trading just above its Pivot levels of 1619 and is moving into a Mild Bearish channel. The price of ETHUSD is now testing its Classic support levels of 1591 and Fibonacci support levels of 1612 after which the path towards 1600 will get cleared.

    Relative Strength Index is at 40 indicating a WEAK market and the continuation of the Downtrend in the markets.
    We can see that Aroon Indicator is giving the Bearish signal in the 2 hourly timeframe.
    Both the STOCHRSI and Williams Percent Range are indicating an Oversold market, which means that the prices are due for an Upwards correction.
    All of the Technical indicators are giving a STRONG SELL market Signal.
    All of the Moving Averages are giving a STRONG SELL Signal and we are now looking at the levels of $1600 to $1550 in the short-term range.
    ETH is now trading Below its both the 100 Hourly Simple and Exponential Moving Averages.

    • Ether Bearish Reversal seen Below the $1783 mark.
    • Short-term range appears to be Mild BEARISH.
    • ETH continues to remain above the $1600 levels.
    • Average True Range is indicating LESS Market Volatility.

    Ether Bearish Reversal Seen Below $1783


    ETHUSD is now moving into a Mild Bearish Channel with the prices trading above the $1600 handle in the European Trading session today.
    We have also detected the formation of the Adaptive Moving Average 20 and 50 Crossover pattern in the 2 hourly time-frame indicating that the price is likely to descend in the short-term range.
    We can see the formation of a Major contraction triangle below the $1700 levels in the 1-hour timeframe.

    The key support levels to watch are $1595 and $1506 and the prices of ETHUSD need to remain above these levels for any potential Bullish reversal in the markets.

    ETH has decreased by 1.93% with a price change of 31$ in the past 24hrs and has a trading volume of 15.964 Billion USD.
    We can see a Decrease of 14.86% in the total trading volume in last 24 hrs. which appears to be Normal.


    The Week Ahead

    We can see that ETH failed to clear its Major resistance zone located at $1800 levels and is now preparing to enter into a consolidation phase above the $1600 levels.
    The prices of Ethereum are slowly recovering against the US Dollar and we can see some range bound moves in the short-term range.
    The immediate short-term outlook for the Ether has turned as Mild BEARISH, the medium-term outlook remains NEUTRAL, and the long-term outlook for Ether is NEUTRAL in present market conditions.
    The prices of ETHUSD will need to remain above the important support levels of $1500 this week.
    Weekly outlook is projected at $1650 with a consolidation zone of $1500.

    Technical Indicators:

    Relative Strength Index (14): It is at 40.99 indicating a SELL.
    Moving Averages Convergence Divergence (12,26): It is at -1.66 indicating a SELL.
    Rate of Price Change: It is at -2.17 indicating a SELL.
    Ultimate Oscillator: It is at 31.86 indicating a SELL.


    VIEW FULL ANALYSIS VISIT - FXOpen Blog

  6. #486
    Junior Member FXOpen Trader's Avatar
    Join Date
    Dec 2020
    Location
    Asia
    Posts
    1,750
    Gold Price Rallies While Crude Oil Price Takes Hit


    Gold price started a fresh increase above the $1,750 resistance zone. Crude oil price is sliding and remains at a risk of more losses below $90.

    Important Takeaways for Gold and Oil

    • Gold price gained pace after it cleared the $1,750 resistance against the US Dollar.
    • Recently, there was a break above a key bearish trend line with resistance near $1,762 on the hourly chart of gold.
    • Crude oil price started a fresh decline from the $96.00 and $96.50 resistance levels.
    • There is a crucial bearish trend line forming with resistance near $91.20 on the hourly chart of XTI/USD.


    Gold Price Technical Analysis

    Gold price formed a base above the $1,700 level and started a fresh increase against the US Dollar. The price broke the $1,720 resistance to move into a positive zone.

    There was a clear move above the $1,750 resistance and the 50 hourly simple moving average. Besides, there was a break above a key bearish trend line with resistance near $1,762 on the hourly chart of gold.

    The price traded as high as $1,794 on FXOpen and the price is now consolidating gains. An immediate support on the downside is near the $1,788 level.

    The price even traded below the $1,700 level and formed a low near $1,680 on FXOpen. It is now correcting losses above the $1,695 level. On the downside, an initial support is near the $1,785 level. It is near the 23.6% Fib retracement level of the upward move from the $1,754 swing low to $1,794 high.

    The next major support is near the $1,774 level or the 50% Fib retracement level of the upward move from the $1,754 swing low to $1,794 high, below which there is a risk of a larger decline. In the stated case, the price could decline sharply towards the $1,750 support zone.

    On the upside, the price is facing resistance near the $1,795 level. A clear upside break above the $1,795 resistance could send the price towards $1,812. The main resistance is now forming near the $1,820 level. A close above the $1,820 level could open the doors for a steady increase towards $1,840.


    VIEW FULL ANALYSIS VISIT - FXOpen Blog

  7. #487
    Junior Member FXOpen Trader's Avatar
    Join Date
    Dec 2020
    Location
    Asia
    Posts
    1,750
    FXOpen’s TOP-10 July 2022 PAMM Accounts


    The better part of the summer has already passed, but the PAMM trading process goes non-stop, delighting investors with new positive results. We would like to focus on those accounts that are still stable and profitable for their subscribers.

    As of August 1, 2022, 141 active accounts have been opened at FXOpen, and 2’427’960.00 USD of subscribers’ funds have been invested, according to Investflow monitoring statistics.

    VIEW FULL NEWS VISIT - FXOpen Company Blog...

  8. #488
    Junior Member FXOpen Trader's Avatar
    Join Date
    Dec 2020
    Location
    Asia
    Posts
    1,750
    GBP/USD Faces Resistance While USD/CAD Is Surging


    GBP/USD could gain pace if it clears the 1.2100 resistance zone. USD/CAD is surging and could continue to rise above the 1.3000 resistance zone.

    Important Takeaways for GBP/USD and USD/CAD

    • The British Pound is attempting an upside break above the 1.2100 resistance zone.
    • There is a key bearish trend line forming with resistance near 1.2100 on the hourly chart of GBP/USD.
    • USD/CAD started a fresh increase above the 1.2920 resistance zone.
    • There was a break above a declining channel with resistance near the 1.2865 on the hourly chart.


    GBP/USD Technical Analysis


    After facing sellers near 1.2280, the British Pound started a fresh decline against the US Dollar. GBP/USD declined heavily below the 1.2200 support zone.

    There was a move below the 1.2100 support zone and the 50 hourly simple moving average. The pair traded as low as 1.2004 and is currently correcting higher. There was a clear move above the 1.2030 resistance zone.

    The pair climbed above the 23.6% Fib retracement level of the downward move from the 1.2168 swing high to 1.2004 low. An immediate resistance is near the 1.2080 level.

    There is also a key bearish trend line forming with resistance near 1.2100 on the hourly chart of GBP/USD. The next key resistance is near the 1.2105 level. It is near the 50% Fib retracement level of the downward move from the 1.2168 swing high to 1.2004 low.

    If there is an upside break above the 1.2100 zone, the pair could rise towards 1.2150. The next key resistance could be 1.2200, above which the pair could gain strength.

    On the downside, an initial support is near the 1.2040 area. The first major support is near the 1.2000 level. If there is a break below 1.2000, the pair could extend its decline. The next key support is near the 1.1960 level. Any more losses might call for a test of the 1.1850 support.


    VIEW FULL ANALYSIS VISIT - FXOpen Blog

  9. #489
    Junior Member FXOpen Trader's Avatar
    Join Date
    Dec 2020
    Location
    Asia
    Posts
    1,750
    The Roaring 20s! How trading the markets has advanced in just a few years


    The 2020s is an exciting time to be trading the global markets.

    In the previous decade, the electronic markets went through a revolutionary period. We witnessed the invention and uprising of cryptocurrencies, the 'influencer' generation beginning to move into the financial markets with memes and internet-based trends, and we saw the entire existing framework change in dramatic restructures in the trading methods of financial products traded on the electronic markets in the wake of the 2008/2009 financial crises.

    European and American authorities began to make major changes which have fomented the sustainability of the electronic derivatives trading markets where traditional asset classes such as Forex, commodities and equities are concerned, and a whole host of decentralized asset classes have joined them along the way.

    As the last exciting decade of revolutionary technological and regulatory development came to an end, the 2020s became a period of limitless innovation, in which FinTech, cryptocurrency and multi-asset trading has been embraced.

    Along with the community-driven cryptocurrency revolution and its entry into the mainstream, came various geopolitical milestones that are unprecedented.


    Lockdowns, inflation and a volatile commodities market, as well as a myriad of new traders who had switched their ambitions from working for a company prior to the lockdowns to seeking their own financial independence from the convenience of their own laptop or smartphone by trading the markets. We have entered the age of the analytical, pragmatic and goal-orientated trader.

    Despite the cryptocurrency revolution and the massive number of people getting involved in investing in Bitcoin, Ethereum and all manner of new native tokens that are now hot property, the commodities market is the hot topic of the decade, and to be more specific: Oil.

    Just as the oil market is as traditional as the actual fossil fuel itself, the modern stock market is the absolute opposite! A new era has come about, born out of the minds of mavericks and entrepreneurs seeking to build a community-driven marketplace where influencers are beginning to become market makers in their own right.


    The ever-changing and ever increasingly innovative markets are at your fingertips. These are the times when your financial destiny is in your hands.

    FXOpen Blog

  10. #490
    Junior Member FXOpen Trader's Avatar
    Join Date
    Dec 2020
    Location
    Asia
    Posts
    1,750
    BTCUSD and XRPUSD Technical Analysis – 09th AUG 2022


    BTCUSD: Bullish Engulfing Pattern Above $22425

    Bitcoin was unable to sustain its bearish momentum and after touching a low of 22431 on 04th Aug started to correct upwards against the US dollar crossing the $24000 handle on 08th Aug.

    We can see that bitcoin failed to clear its resistance zone located at $25000 for the second time this month.

    After touching a high of $24230 we can see some downwards correction in the prices towards the $23800 level.

    We can clearly see a bullish engulfing pattern above the $22425 handle which is a bullish reversal pattern because it signifies the end of a downtrend and a shift towards an uptrend.

    Bitcoin touched an intraday high of 23922 in the Asian trading session and an intraday low of 23639 in the Asian trading session today.

    Both the STOCH and Williams percent range are indicating overbought levels which means that in the immediate short term, a decline in the prices is expected.

    The relative strength index is at 50 indicating a NEUTRAL demand for bitcoin at the current market levels and the continuation of the consolidation phase in the markets.

    Bitcoin is now moving above its 100 hourly simple moving average and its 200 hourly simple moving averages.

    Some of the major technical indicators are giving a buy signal, which means that in the immediate short term, we are expecting targets of 24000 and 24500.

    The average true range is indicating less market volatility with a mildly bullish momentum.

    • Bitcoin: bullish reversal seen above $22425
    • The STOCHRSI is indicating an oversold level
    • The price is now trading just below its pivot levels of $23858
    • Some of the moving averages are giving a buy market signal


    Bitcoin: Bullish Reversal Seen Above $22425


    The price of bitcoin is struggling to move above the $24000 handle after it entered into a consolidation zone below the $24000 level.

    The overall scenario of the markets is neutral at present; we will have to wait till some clear signals emerge for the medium-term range.

    We can see that Ichimoku price is under the cloud in the 15-minute time frame indicating the underlying bearish nature of the markets.

    The immediate short-term outlook for bitcoin is neutral; the medium-term outlook has turned neutral; and the long-term outlook remains neutral under present market conditions.

    Bitcoin’s support zone is located at $22000 and the prices continue to remain above these levels for the continuation of the bullish reversal in the markets.

    The price of BTCUSD is now facing its classic resistance level of 23899 and Fibonacci resistance level of 23932 after which the path towards 24000 will get cleared.

    In the last 24hrs, BTCUSD has declined by 0.32% by 76$ and has a 24hr trading volume of USD 28.827 billion. We can see an increase of 50.20% in the trading volume as compared to yesterday, which is due to the buying seen by the short-term investors.

    The Week Ahead

    The price of bitcoin is moving in a consolidation zone under the $24000 level. The price is expected to remain moving into a narrow range between the $23000 and $24000 before any potential breakouts.

    The daily RSI is printing at 59 which indicates a bullish market and the move towards the $25000 level.

    The trendline formation is seen from the $22400 levels towards the $24000, and we are now looking for the continuation of this trend in the hourly time frame.

    The price of BTCUSD will need to remain above the important support level of $22000 this week.

    The weekly outlook is projected at $24000 with a consolidation zone of $23000.

    Technical Indicators:

    The average directional change (14 days): at 15.10 indicating a neutral

    The ultimate oscillator: at 68.29 indicating a BUY

    The relative strength index (14): at 52.53 indicating a neutral

    The commodity channel index (14 days): at -19.17 indicating a neutral

    VIEW FULL ANALYSIS VISIT - FXOpen Blog

Page 49 of 145 FirstFirst ... 39 47 48 49 50 51 59 99 ... LastLast

Bookmarks

Posting Permissions

  • You may not post new threads
  • You may not post replies
  • You may not post attachments
  • You may not edit your posts
  •