
 LinkBack URL
 About LinkBacks


GBP/USD and GBP/JPY Face Uphill Task
GBP/USD started a fresh decline from the 1.2320 resistance zone. GBP/JPY declined and remains at a risk of more losses below 162.00.
Important Takeaways for GBP/USD and GBP/JPY
- The British Pound started a fresh decline after it failed near 1.2320 against the US Dollar.
- There is a major bearish trend line forming with resistance near 1.2120 on the hourly chart of GBP/USD.
- GBP/JPY declined steadily after it failed to clear the 167.00 resistance zone.
- There is a key bearish trend line forming with resistance near 164.25 on the hourly chart.
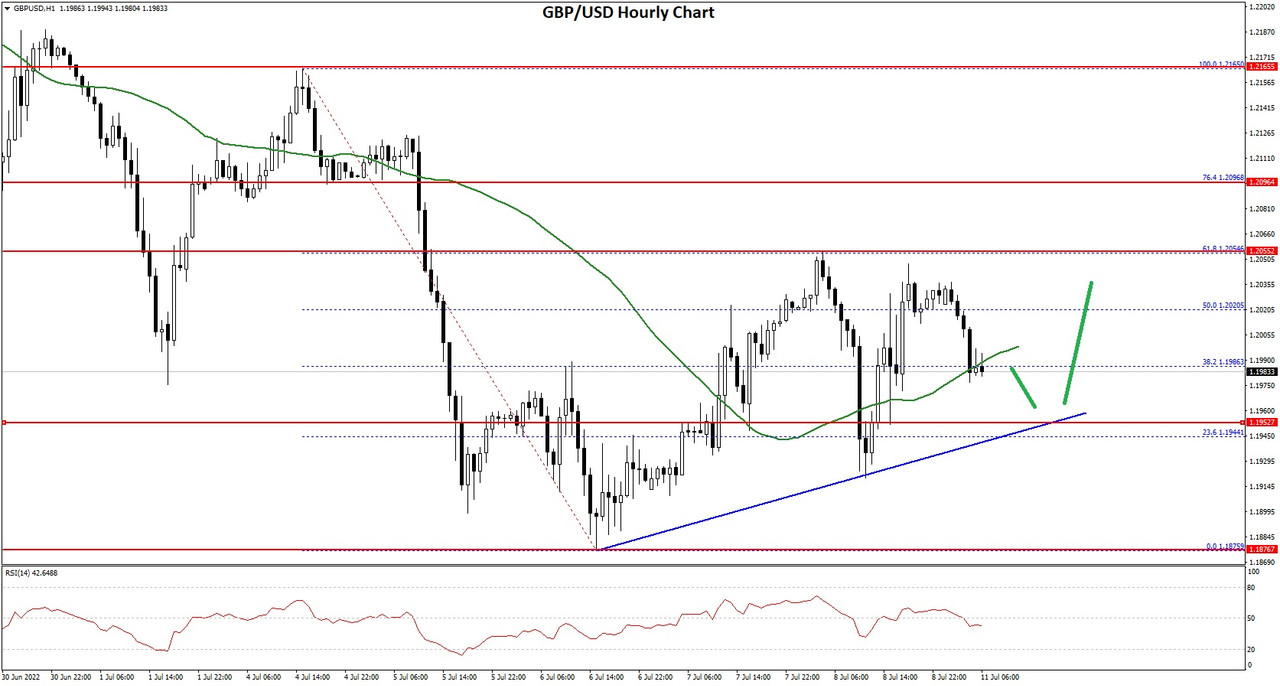
GBP/USD Technical Analysis
This past week, the British Pound attempted an upside break above the 1.2320 resistance against the US Dollar. The GBP/USD pair failed to gain bullish momentum and started a fresh decline from the 1.2200 zone.
There was a sharp decline below the 1.2150 support and the 50 hourly simple moving average. The pair even traded below the 1.2000 support zone. A low was formed near 1.1975 on FXOpen before the pair started a recovery wave.
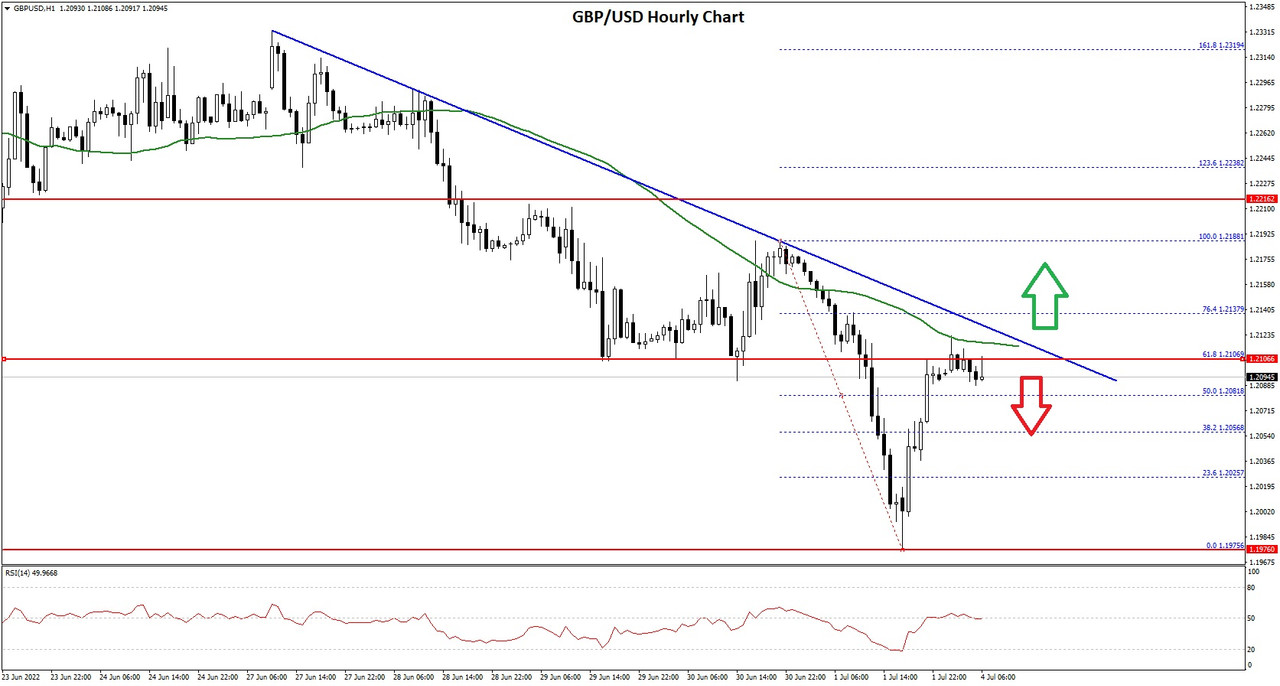
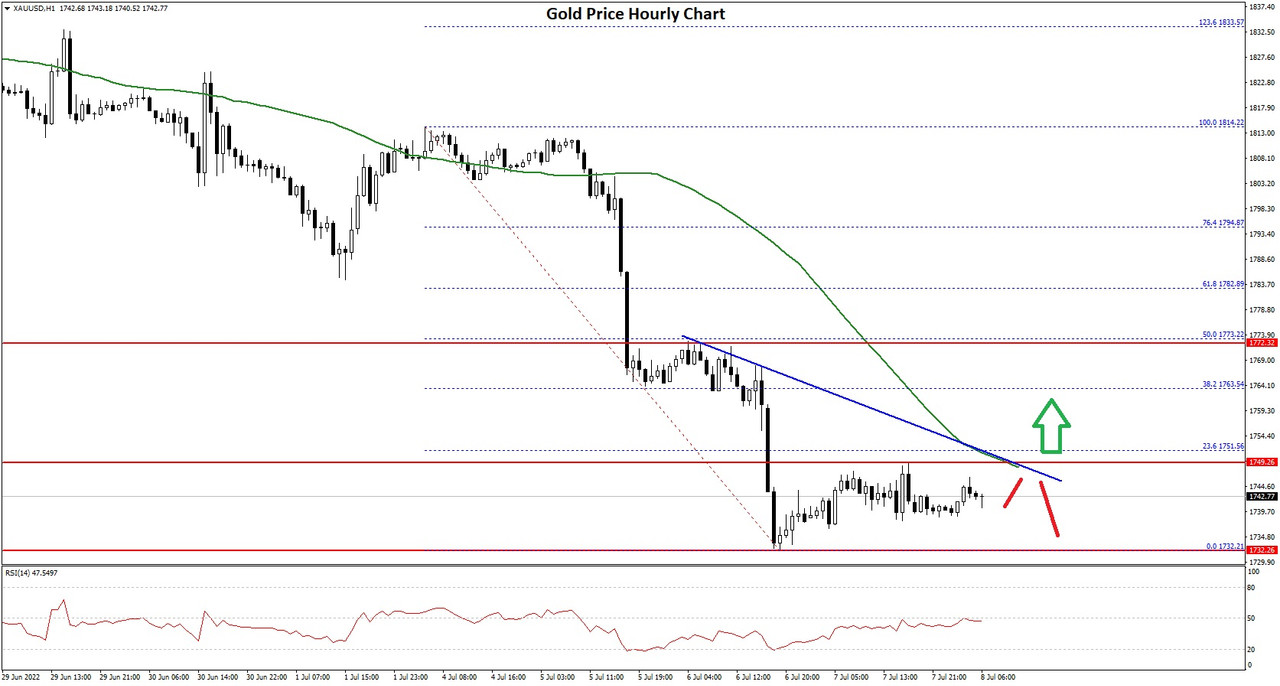
GBP/USD Hourly Chart
The pair climbed above the 1.2050 resistance zone. It even broke the 50% Fib retracement level of the downward move from the 1.2188 swing high to 1.1975 low.
On the upside, the pair is facing resistance near the 1.2110 level. It is near the 61.8% Fib retracement level of the downward move from the 1.2188 swing high to 1.1975 low. There is also a major bearish trend line forming with resistance near 1.2120 on the hourly chart of GBP/USD.
An upside break above 1.2120 could set the pace for a move towards the 1.2200 resistance zone. If there is no upside break above 1.2120, the pair could start a fresh decline.
An immediate support is near the 1.2050. The next major support is near the 1.2000 level. If there is a break below the 1.2000 support, the pair could test the 1.1920 support.
Read Full on FXOpen Company Blog...


 Reply With Quote


Bookmarks