
 LinkBack URL
 About LinkBacks


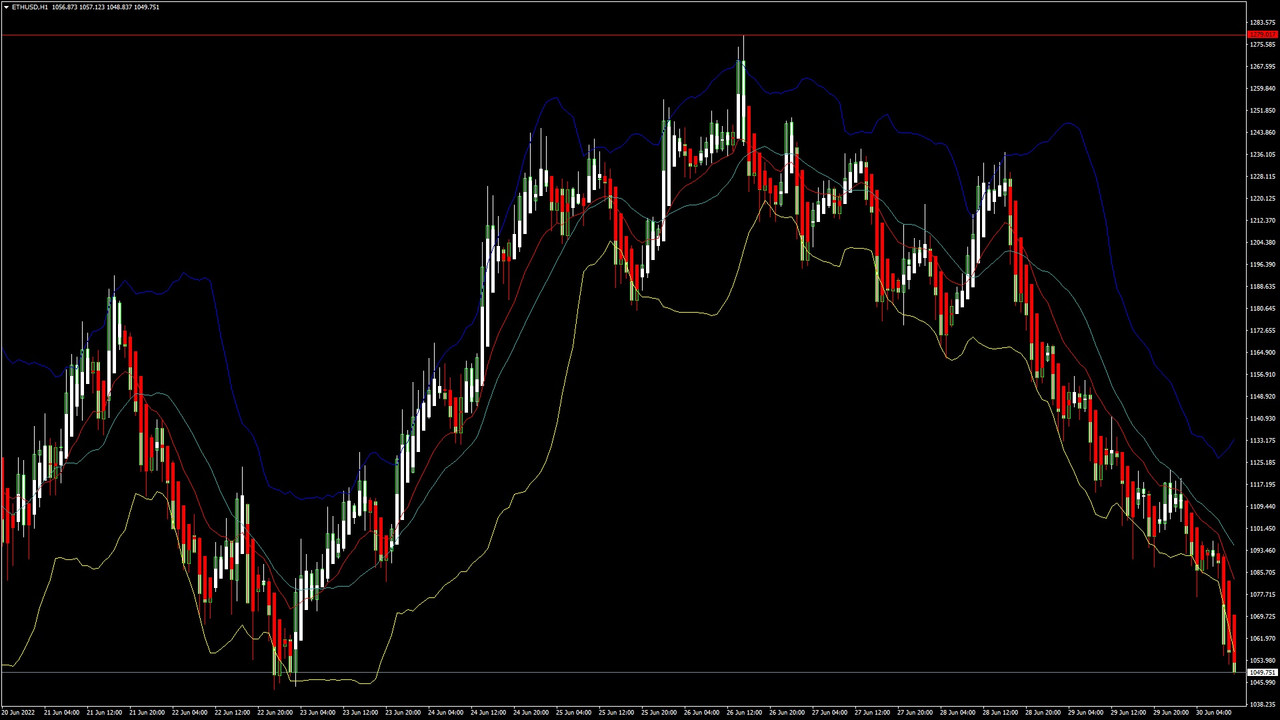
ETHUSD and LTCUSD Technical Analysis 23rd JUNE, 2022
ETHUSD Bullish Harami Pattern Above $936
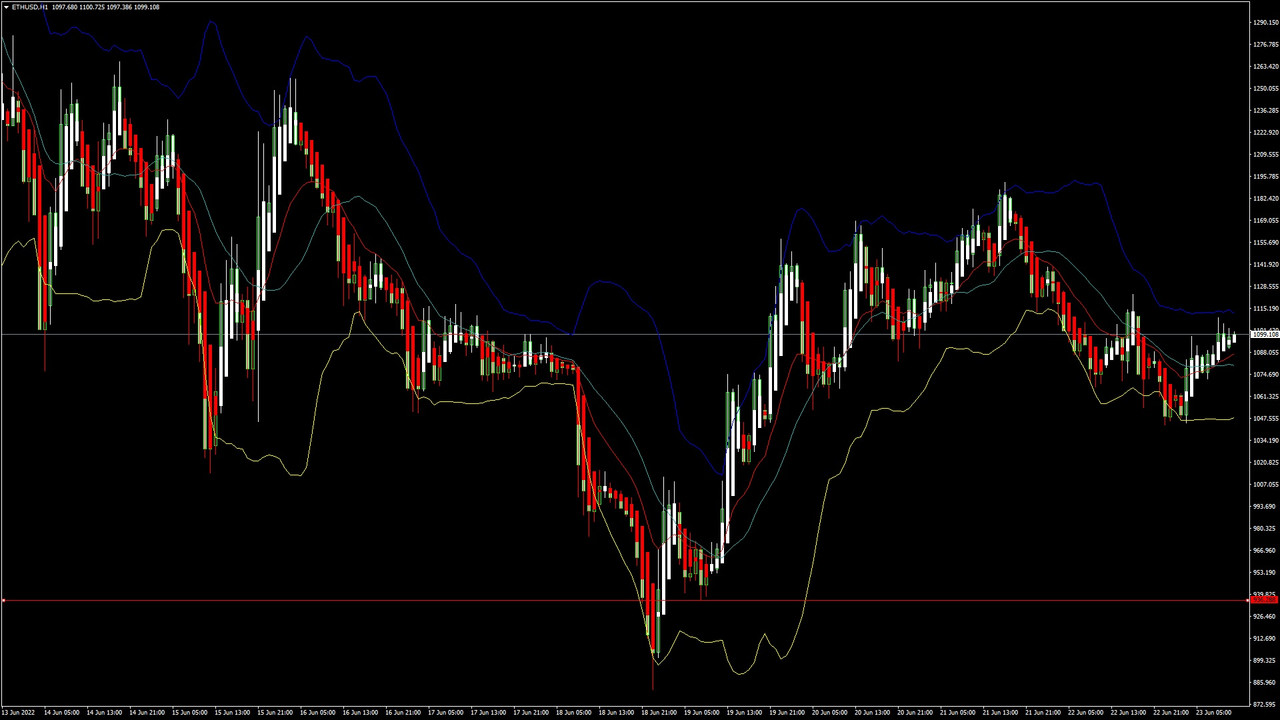
Ethereum was unable to sustain its bearish momentum and after touching a low 893 on 18th June started to correct upwards against the US Dollar.
We can see that the prices have recovered from its lows and a pullback action is seen at levels below $1000.
We can see the formation of a Bullish Ascending channel below the $1000 handle and now we are looking at $1100 and $1250 as the immediate targets.
The prices touched an Intraday Low of $1046 in the Asian Trading session and an Intraday High of $1107 in the European Trading session today.
We can clearly see a Bullish Harami Pattern Above the $936 handle which is a Bullish pattern and signifies the end of a Bearish phase and the start of a Bullish phase in the markets.
ETH is now trading above its Pivot levels of 1096 and is moving into a Strong Bullish channel. The price of ETHUSD is now testing its Classic resistance levels of 1101 and Fibonacci resistance levels of 1110 after which the path towards 1200 will get cleared.
Relative Strength Index is at 52 indicating a NEUTRAL market and the shift towards the consolidation phase in the markets.
Both the STOCHRSI and Williams Percent Range are indicating Overbought levels, which means that the prices are due to correct downwards in the short-term range.
ALL of the of the Technical indicators are giving a STRONG BUY market Signal.
Most of the Moving Averages are giving a BUY Signal and we are now looking at the levels of $1100 to $1250 in the short-term range.
ETH is now trading Above its both the 100 Hourly Simple and Exponential Moving Averages.
- Ether Bullish Reversal seen Above the $936 mark.
- Short-term range appears to be Strongly BULLISH.
- ETH is poised for an upwards Rally against the US Dollar.
- Average True Range is indicating LESS Market Volatility.
Ether Bullish Reversal Seen Above $936
ETHUSD is now moving into a Strong Bullish Channel with the prices trading above the $1100 handle in the European Trading session today.
The On Balance Volume is indicating that the demand from the buyers and sellers is in equilibrium, meaning that the present prices of Ether are moving into a consolidation phase.
Now we are looking at the possibility of a Rally into the markets which could push the prices of Ether above the $1500 levels soon.
The key resistance levels to watch are $1275 and $1300 and the prices of ETHUSD need to cross these levels for the continuation of the Bullish reversal.
ETH has increased by 1.50% with a price change of 16$ in the past 24hrs and has a trading volume of 14.913 Billion USD.
We can see an Increase of 3.86% in the total trading volume in last 24 hrs. which appears to be Normal.
The Week Ahead
The global investor sentiments have improved as we can see a recovery of almost 30% from a low of $893 to a high of $1189 reached yesterday.
The prices of Ethereum continue to remain above the important psychological support levels of $1000 and we can witness an upwards Rally into the markets in the next week.
The immediate short-term outlook for the Ether has turned as Strongly BULLISH, the medium-term outlook has turned NEUTRAL, and the long-term outlook for Ether is NEUTRAL in present market conditions.
In this week Ether is expected to move in a range between the $1100 and $1250 and in the next week Ether is expected to enter into a Consolidation phase above the $1250 levels.
Technical Indicators:
STOCH (9,6): It is at 76.59 indicating a BUY.
Average Directional Change(14days): It is at 23.69 indicating a BUY.
Rate of Price Change: It is at 3.61 indicating a BUY.
Commodity Channel Index(14days): It is at 129.70 indicating a BUY.
Read Full on FXOpen Company Blog...


 Reply With Quote


Bookmarks