Page 42 of 146 FirstFirst ... 32 40 41 42 43 44 52 92 142 ... LastLast
Results 411 to 420 of 1458

Daily Market Analysis By FXOpen

This is a discussion on Daily Market Analysis By FXOpen within the Analytics and News forums, part of the Trading Forum category; ETHUSD and LTCUSD Technical Analysis – 12th MAY, 2022 ETHUSD: Double Top Pattern Below $2,450 Ethereum was unable to sustain ...


  1. #411
    Junior Member FXOpen Trader's Avatar
    Join Date
    Dec 2020
    Location
    Asia
    Posts
    1,769
    ETHUSD and LTCUSD Technical Analysis – 12th MAY, 2022


    ETHUSD: Double Top Pattern Below $2,450

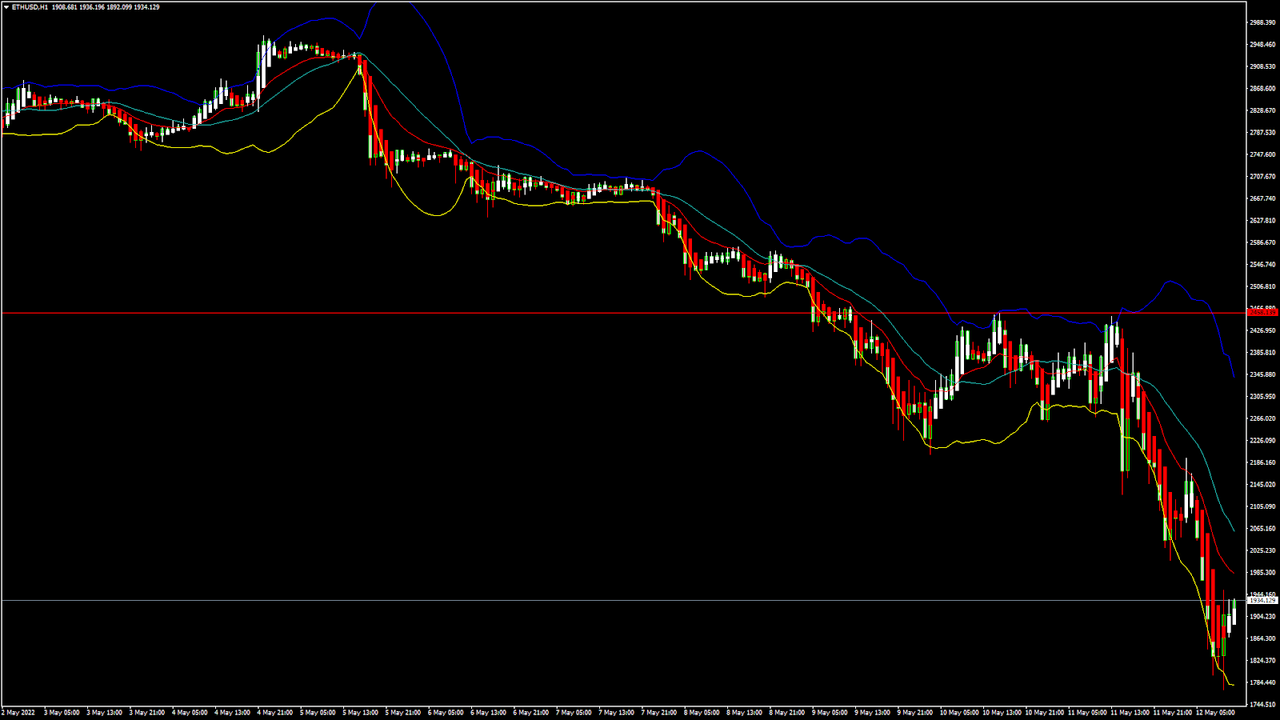
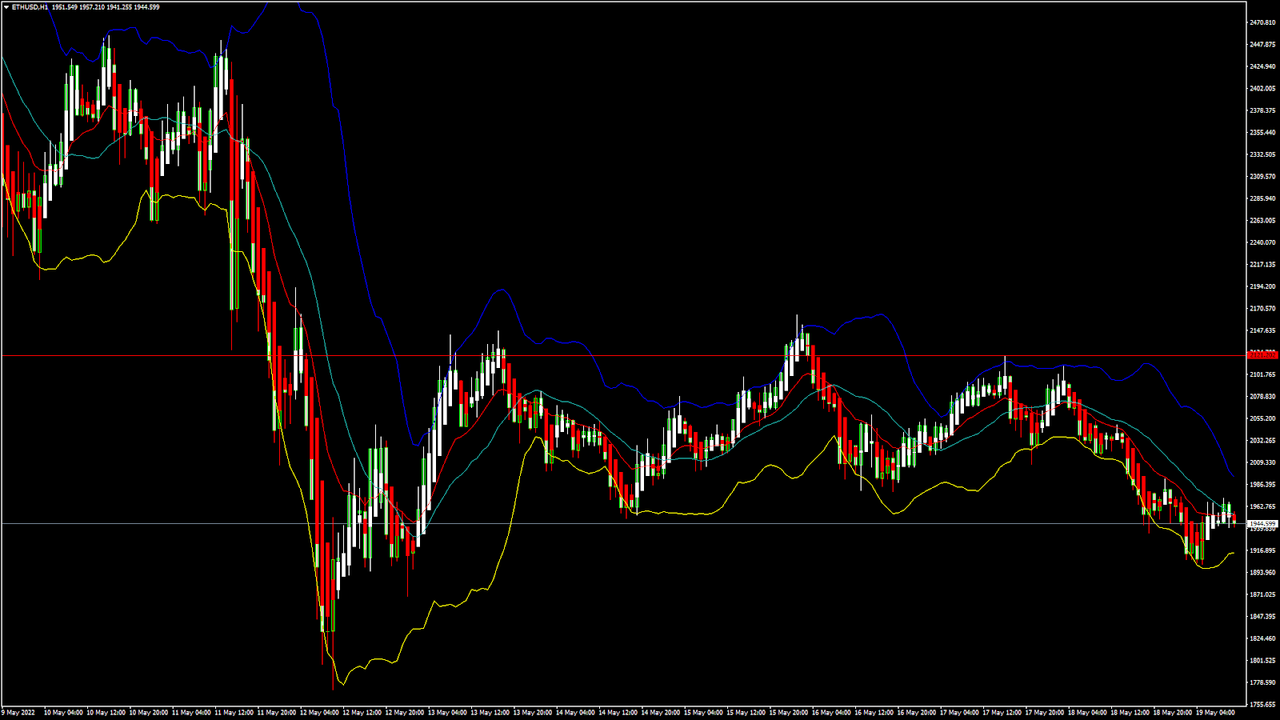
    Ethereum was unable to sustain its bullish momentum last week, and after touching a high of 2,960 on May 4, started to decline heavily against the US dollar.

    We can see the continuation of the bearish momentum this week, and the decline continues pulling down the prices of Ethereum below the 1,900 handle in the European trading session today.

    The global investor sentiment is very weak, which is the cause of the massive slide in the cryptocurrency markets, including Ethereum.

    After touching an intraday low of $1,780, we can see some pullback action and a move towards the consolidation channel above the $1,800 handle.

    We can clearly see a double top pattern below the $2,450 handle, which is a bearish pattern; it signifies the end of a bullish phase and the start of a bearish phase in the markets.

    ETH is now trading just below its pivot level of 1,908 and moving into a consolidation channel. The price of ETHUSD is now testing its classic support level of 1,820 and Fibonacci support level of 1,884, after which the path towards 1,800 will get cleared.

    The relative strength index is at 35, indicating a WEAK demand for Ethereum and the continuation of the bearish trend.

    The StochRSI is indicating a neutral level which means that the prices are due to remain into a consolidation phase in the short term.

    All of the technical indicators are giving a STRONG SELL market signal.

    All of the moving averages are giving a STRONG SELL signal, and we are now looking at the levels of $1,850 to $1,800 in the short-term range.

    ETH is now trading Below both the 100 hourly and exponential MAs.

    • Ether: a bearish reversal is seen below the $2,450 mark
    • The short-term range appears to be mildly BEARISH
    • The daily RSI is below 50 at 24, indicating an OVERSOLD market
    • The average true range is indicating HIGH market volatility


    Ether: Bearish Reversal Seen Below $2,450


    ETHUSD is now moving in a mildly bearish channel with the prices trading below the $2,000 handle in the European trading session today.

    We can see an MA5 crossover pattern located at 1,884, which means that a potential bullish reversal is possible after touching these levels.

    ETHUSD is now facing its immediate support level of $1,861 and $1,841 after which we will see a linear progression towards the level of $1,800.

    The key resistance levels to watch are $1,931 and $1,976, and the prices of ETHUSD need to cross these levels for a potential bullish reversal.

    ETH has declined by 19.67% with a price change of 468.56$ in the past 24hrs and has a trading volume of 54.488 Billion USD.

    We can see an Increase of 53.79% in the total trading volume in the last 24 hrs. which is due to the heavy selling by long-term investors.

    The Week Ahead

    The global economic factors and the increase in the interest rate announced by the Fed have made the US dollar stronger, which has led to a massive decline in the prices of Ethereum.

    The delay in the implementation of the ETH 2.0 upgrade is also keeping the investors away from the markets.

    The immediate short-term outlook for Ether has turned mildly BEARISH; the medium-term outlook has turned neutral; the long-term outlook for Ether is NEUTRAL in present market conditions.

    This week, Ether is expected to move in a range between $1,800 and $2,000, and next week, Ether is expected to enter into a consolidation phase above the level of $2,000.

    Technical Indicators:

    The Stoch (9,6): at 22.35 indicating a SELL

    The moving averages convergence divergence (12,26): at -104.87 indicating a SELL

    The ultimate oscillator: at 40.75 indicating a SELL

    The rate of price change: at -9.43 indicating a SELL


    Read Full on FXOpen Company Blog...

  2. #412
    Junior Member FXOpen Trader's Avatar
    Join Date
    Dec 2020
    Location
    Asia
    Posts
    1,769
    Gold Price Faces Resistance While Oil Price Aims Higher


    Gold price started a fresh decline from the $1,920 resistance. Crude oil price is rising and might gain pace above the $107 resistance.

    Important Takeaways for Gold and Oil

    • Gold price started a fresh decline from well above the $1,900 zone against the US Dollar.
    • There is a key bearish trend line forming with resistance near $1,840 on the hourly chart of gold.
    • Crude oil price gained pace after it broke the $102 and $104 resistance levels.
    • There was a break above a major bearish trend line with resistance near $104.05 on the hourly chart of XTI/USD.


    Gold Price Technical Analysis


    Gold price struggled to gain pace for a move above the $1,920 resistance against the US Dollar. The price started a fresh decline below the $1,900 support zone.

    There was a clear move below the $1,880 level and the 50 hourly simple moving average. The price even declined below the $1,850 support to move into a bearish zone. It traded as low as $1,810 on FXOpen and now correcting losses.

    Gold Price Hourly Chart

    There was a move above the $1,820 resistance. The price broke the 23.6% Fib retracement level of the downward move from the $1,858 swing high to $1,810 low.

    On the upside, the price is facing resistance near the $1,835 level. It is near the 50% Fib retracement level of the downward move from the $1,858 swing high to $1,810 low. Besides, there is a key bearish trend line forming with resistance near $1,840 on the hourly chart of gold.

    The main resistance is now forming near the $1,840 level. A close above the $1,840 level could open the doors for a steady increase towards $1,880. The next major resistance sits near the $1,900 level.

    On the downside, an initial support is near the $1,820 level. The next major support is near the $1,810 level, below which there is a risk of a larger decline and the price might even struggle to stay above $1,800.

    Read Full on FXOpen Company Blog...

  3. #413
    Junior Member FXOpen Trader's Avatar
    Join Date
    Dec 2020
    Location
    Asia
    Posts
    1,769
    GBP/USD Remains At Risk, USD/CAD Eyes More Gains


    GBP/USD started a major decline below the 1.2300 support. USD/CAD is showing positive signs and gaining pace above the 1.2950 level.

    Important Takeaways for GBP/USD and USD/CAD

    • The British Pound started a fresh decline from the 1.2400 resistance zone.
    • There was a break above a short-term bearish trend line with resistance near 1.2220 on the hourly chart of GBP/USD.
    • USD/CAD started a fresh increase from well below the 1.2650 zone.
    • There was a break above a key bearish trend line with resistance near 1.2965 on the hourly chart.


    GBP/USD Technical Analysis

    After struggling to clear the 1.2400 resistance zone, the British Pound found started a fresh decline against the US Dollar. GBP/USD traded below the 1.2300 support level to move into a bearish zone.

    The bears gained strength for a move below the 1.2200 level and the 50 hourly simple moving average. The pair even spiked below the 1.2180 level and traded as low as 1.2155 on FXOpen. Recently, there was an upside correction above the 1.2200 level.

    GBP/USD Hourly Chart


    There was a break above a short-term bearish trend line with resistance near 1.2220 on the hourly chart of GBP/USD. The pair even spiked above the 50% Fib retracement level of the downward move from the 1.2399 swing high to 1.2155 low.

    An immediate resistance is near the 1.2295 level. The next key resistance is near the 1.2305 level. It is near the 61.8% Fib retracement level of the downward move from the 1.2399 swing high to 1.2155 low.

    If there is an upside break above the 1.2305 zone, the pair could rise towards 1.2400. The next key resistance could be 1.2450, above which the pair could gain strength.

    On the downside, an initial support is near the 1.2220 area. The first major support is near the 1.2200 level. If there is a break below 1.2200, the pair could extend its decline. The next key support is near the 1.2150 level. Any more losses might call for a test of the 1.2040 support.

    Read Full on FXOpen Company Blog...

  4. #414
    Junior Member FXOpen Trader's Avatar
    Join Date
    Dec 2020
    Location
    Asia
    Posts
    1,769
    Investors Keep Selling the JPY Despite Falling to the Lowest Since 2002 vs. the US Dollar


    One of the big stories in the FX market in 2022 is the spectacular drop of the Japanese yen (JPY). Since March, it has depreciated against all its peers to reach the weakest levels vs. the US dollar since 2002.

    Interestingly enough, the selloff comes when investors had all the reasons to buy the Japanese currency – not to sell it. Historically, the JPY acted as a safe-haven currency.

    Effectively, it means that traders bought the JPY and sold US equities in times of uncertainty. Well, one did happen – US stocks are down by about -20% or more, depending on the sector. But the JPY did the opposite.


    BOJ’s Measures Put Pressure on the Yen

    The trigger of the yen’s weakness was the Bank of Japan’s policy. It continues to suppress bond yields, making JGBs or Japanese Government Bonds less attractive – and the yen too.

    This is a central bank that diverges from other major central banks in the sense that it keeps easing conditions while others have started to tighten. The Federal Reserve of the United States is the perfect example, doing exactly the opposite of what the Bank of Japan is doing. Hence, the yen reached the weakest level in more than two decades against the US dollar.

    But before blaming it all on the Bank of Japan, one thing should ring a bell for FX traders. If it was only the JPY declining the way it did, then the Bank of Japan was the sole reason for it.

    Except it wasn’t.

    The other safe-haven currency, the Swiss franc, dropped even more against the US dollar. The USD/CHF exchange rate rose above parity for the first time in many years as investors ran from the so-called safe-haven currencies and bought the US dollar – the world’s reserve currency.

    So, what comes next?

    Because of the Swiss franc is dropping in a similar or even more aggressive fashion, it means that the price action in the FX market is driven by the US dollar and the Fed and not by the Bank of Japan and the yen. Hence, look for the trend to continue as the move may have just started.

    FXOpen Blog

  5. #415
    Junior Member FXOpen Trader's Avatar
    Join Date
    Dec 2020
    Location
    Asia
    Posts
    1,769
    BTCUSD and XRPUSD Technical Analysis – 17th MAY 2022


    BTCUSD: Bullish Harami Pattern Above $28,600

    Bitcoin was not able to sustain its bullish momentum last week, and after touching a high of $31,437 on 16th May, started to decline heavily against the US dollar.

    The short selling continued pushing down the price of BTC below the $30,000 handle, touching a low of $29,169 after which we can see some consolidation.

    We can see a pullback in the markets at a level above $30,000, which is expected to continue towards $33,000.

    We can clearly see a bullish harami pattern above the $28,600 handle which is a bullish reversal pattern because it signifies the end of a downtrend and a shift towards an uptrend.

    Both the Stoch and StochRSI are indicating an overbought level which means that in the immediate short term, a decline in the prices is expected.

    The relative strength index is at 57 indicating a STRONG demand for bitcoin at the current market level.

    Bitcoin is now moving above its 100 hourly simple and 200 hourly simple MAs.

    Most of the major technical indicators are giving a STRONG BUY signal, which means that in the immediate short term, we are expecting targets of 32,000 and 33,500.

    The average true range is indicating LESSER market volatility with a mildly bullish momentum.

    • Bitcoin: bullish reversal seen above $28,600
    • The Williams percent range is indicating an OVERBOUGHT level
    • The price is now trading just above its pivot level of $30,443
    • All of the moving averages are giving a STRONG BUY market signal


    Bitcoin: Bullish Reversal Seen Above $28,600


    Bitcoin continues to move into a consolidation channel above the $30,000 handle in the European trading session today.

    The bounce that we have seen above the $30,000 handle is expected to continue this week, and we are now looking at the targets of $32,000 and $33,500 in the medium-term range.

    The immediate short-term outlook for bitcoin is mildly bullish; the medium-term outlook has turned neutral; and the long-term outlook remains neutral under present market conditions.

    Bitcoin continues to consolidate above its important support level of $30,000, and with increasing demand zone formation the immediate target is $31,500

    The price of BTCUSD is now facing its classic resistance level of 30,533 and Fibonacci resistance level of 30,653, after which the path towards 32,000 will get cleared.

    In the last 24hrs, BTCUSD has increased by 3.17% by 939$, and has a 24hr trading volume of USD 31.059 billion. We can see an increase of 1.58% in the trading volume as compared to yesterday, which appears to be normal.

    The Week Ahead

    The price of bitcoin is moving in a mildly bullish momentum, and the immediate targets are $31,000 and $31,500

    The daily RSI is printing at 35 which means that the medium-range demand continues to be weak.

    The current market condition is suitable for entering into a BUY position with targets of $32,000 and $33,500 next week.

    The price of BTCUSD will need to remain above the important support level of $30,000 this week.

    The weekly outlook is projected at $32,000 with a consolidation zone of $31,500.

    Technical Indicators:

    The moving averages convergence divergence (12,26): at 121.40 indicating a BUY

    THe average directional change (14-day): at 43.83 indicating a BUY

    The rate of price change: at 3.529 indicating a BUY

    The ultimate oscillator: at 65.16 indicating a BUY


    Read Full on FXOpen Company Blog...

  6. #416
    Junior Member FXOpen Trader's Avatar
    Join Date
    Dec 2020
    Location
    Asia
    Posts
    1,769
    EUR/USD Recovers Ground, USD/CHF Could Extend Losses


    EUR/USD started a decent increase from the 1.0350 zone. USD/CHF is sliding and might extend losses below the 0.9900 support zone.

    Important Takeaways for EUR/USD and USD/CHF

    • The Euro started a recovery wave from the 1.0350 support zone against the US Dollar.
    • There was a break above a major bearish trend line with resistance near 1.0515 on the hourly chart of EUR/USD.
    • USD/CHF topped near the 1.0060 zone and started a downside correction.
    • There was a break below a connecting bullish trend line with support near 1.0020 on the hourly chart.


    EUR/USD Technical Analysis

    The Euro formed a base above the 1.0350 zone and started a decent increase against the US Dollar. The EUR/USD pair climbed above the 1.0420 resistance zone to move into a bullish zone.

    There was a steady increase above the 1.0500 resistance zone and the 50 hourly simple moving average. Besides, there was a break above a major bearish trend line with resistance near 1.0515 on the hourly chart of EUR/USD.

    EUR/USD Hourly Chart


    There was a clear move above the 50% Fib retracement level of the key decline from the 1.0592 swing high (formed on FXOpen) to 1.0350 low.

    It is now consolidating near the 1.0550 level and the 61.8% Fib retracement level of the key decline from the 1.0592 swing high to 1.0350 low. On the upside, an initial resistance is near the 1.0550 level. The next major resistance is near the 1.0580 level.

    A clear move above the 1.0580 resistance zone could set the pace for a larger increase towards 1.0650. The next major resistance is near the 1.0750 zone.

    On the downside, an immediate support is near the 1.0500 level. The next major support is near the 1.0480 level. A downside break below the 1.0480 support could start another decline.

    Read Full on FXOpen Company Blog...

  7. #417
    Junior Member FXOpen Trader's Avatar
    Join Date
    Dec 2020
    Location
    Asia
    Posts
    1,769
    ETHUSD and LTCUSD Technical Analysis – 19th MAY, 2022


    ETHUSD: Double Top Pattern Below $2,121

    Ethereum was unable to sustain its bullish momentum last week, and after touching a high of 2,151 on 16th May started to decline heavily against the US dollar.

    We can see the continuation of the bearish momentum this week, and the decline continues pulling down the prices of Ethereum below the 2,000 handle in the European trading session today.

    With the increase in the market liquidity many of the medium-term investors are selling their stakes amid the ongoing proposed Ethereum 2.0 network upgrade.

    The prices touched an intraday low of $1,902 in the Asian trading session, and an intraday high of $1,971 in the European trading session today.

    We can clearly see a double-top pattern below $2,121 which is a bearish pattern and signifies the end of a bullish phase and the start of a bearish phase in the markets.

    ETH is now trading just below its pivot level of 1,954 and moving into a consolidation channel. The price of ETHUSD is now testing its classic support level of 1,917, and Fibonacci support level of 1,945 after which the path towards 1,800 will get cleared.

    The relative strength index is at 43 indicating a WEAK demand for Ethereum and the continuation of the bearish trend.

    The StochRSI is indicating an overbought level which means that the price is due to decline further in the short term.

    Most of the technical indicators are giving a STRONG SELL market signal.

    All of the moving averages are giving a STRONG SELL signal, and we are now looking at the levels of $1,900 to $1,800 in the short-term range.

    ETH is now trading below its 100 hourly and exponential MAs.

    • Ether: a bearish reversal seen below the mark of $2,121
    • Short-term range appears to be mildly BEARISH
    • The daily RSI is below 50 at 32 indicating a bearish market
    • The average true range is indicating LESS market volatility


    Ether: Bearish Reversal Seen Below $2,121


    ETHUSD is now moving in a mildly bearish channel with the prices trading below the $2,000 handle in the European trading session today.

    We can see an SMA10 crossover pattern located at 1,940, which means that a potential bullish reversal is possible after touching these levels.

    We have detected a bearish harami crossover pattern in the M15 chart which further validates the ongoing trends in the markets.

    The key resistance levels to watch are $1,966 and $1,990, and the prices of ETHUSD need to cross these levels for a potential bullish reversal.

    ETH has declined by 4.41% with a price change of 89.48$ in the past 24hrs, and has a trading volume of 18.320 billion USD.

    We can see an Increase of 5.27% in the total trading volume in the last 24 hrs which appears to be normal.

    The Week Ahead

    The ongoing correction in the prices of Ethereum is also because of the pending ETH 2.0 network upgrade which is delayed from its original schedule. Many of the Ethereum investors are willing to wait till the new upgrade is launched before investing their funds.

    The immediate short-term outlook for Ether has turned mildly BEARISH; the medium-term outlook has turned neutral; and the long-term outlook for Ether is NEUTRAL in present market conditions.

    This week, Ether is expected to move in a range between $1,800 and $2,000, and next week, it is expected to enter into a consolidation phase above the level of $2,000.

    Technical Indicators:

    The Williams percent range: at -55.74 indicating a SELL

    The moving averages convergence divergence (12,26): at -20.99 indicating a SELL

    The ultimate oscillator: at 47.46 indicating a SELL

    The rate of price change: at -1.364 indicating a SELL

    Read Full on FXOpen Company Blog...

  8. #418
    Junior Member FXOpen Trader's Avatar
    Join Date
    Dec 2020
    Location
    Asia
    Posts
    1,769
    AUD/USD and NZD/USD Might Regain Bullish Momentum


    AUD/USD traded higher but faced sellers near 0.7075. NZD/USD is correcting gains and approaching a key support zone near the 0.6350 level.

    Important Takeaways for AUD/USD and NZD/USD

    • The Aussie Dollar started a fresh increase from the 0.6850 support zone against the US Dollar.
    • There is a key bullish trend line forming with support near 0.7000 on the hourly chart of AUD/USD.
    • NZD/USD also started a decent increase after it cleared the 0.6300 resistance zone.
    • There was a move above a major contracting triangle with resistance near 0.6355 on the hourly chart of NZD/USD.


    AUD/USD Technical Analysis

    The Aussie Dollar formed a base above the 0.6850 level and started a fresh increase against the US Dollar. The AUD/USD pair gained pace for a move above the 0.6950 resistance zone.

    There was a clear move above the 0.7000 resistance zone and the 50 hourly simple moving average. The pair traded as high as 0.7072 on FXOpen and is currently correcting gains. There was a move below the 0.7025 support zone.

    AUD/USD Hourly Chart


    The pair is now trading near the 50% Fib retracement level of the upward move from the 0.6949 swing low to 0.7072 high. On the downside, an initial support is near the 0.7000 level.

    There is also a key bullish trend line forming with support near 0.7000 on the hourly chart of AUD/USD. The trend line is near the 61.8% Fib retracement level of the upward move from the 0.6949 swing low to 0.7072 high.

    The next support could be the 0.6950 level. If there is a downside break below the 0.6950 support, the pair could extend its decline towards the 0.6900 level. Any more downsides might send the pair toward the 0.6850 level.

    On the upside, the AUD/USD pair is facing resistance near the 0.7040 level. The next major resistance is near the 0.7075 level. A close above the 0.7075 level could start a steady increase in the near term. The next major resistance could be 0.7150.

    Read Full on FXOpen Company Blog...

  9. #419
    Junior Member FXOpen Trader's Avatar
    Join Date
    Dec 2020
    Location
    Asia
    Posts
    1,769
    GBP/USD and GBP/JPY Could Rise Steadily

    GBP/USD started a fresh increase above the 1.2400 resistance zone. GBP/JPY is consolidating and might rise steadily above the 160.50 resistance zone.

    Important Takeaways for GBP/USD and GBP/JPY

    • The British Pound started a fresh increase above the 1.2420 resistance against the US Dollar.
    • There is a key bullish trend line forming with support near 1.2465 on the hourly chart of GBP/USD.
    • GBP/JPY is showing positive signs above the 158.50 and 159.00 support levels.
    • There is a major bullish trend line forming with support near 159.20 on the hourly chart.


    GBP/USD Technical Analysis

    This past week, the British Pound formed a base above the 1.2150 level against the US Dollar. The GBP/USD pair started a steady increase above the 1.2200 and 1.2320 resistance levels.

    There was also a clear move above the 1.2450 resistance and the 50 hourly simple moving average. The recent price action was bullish, and the pair even climbed above the 1.236 Fib extension level of the downward move from the 1.2500 swing high to 1.2329 low (formed on FXOpen).

    GBP/USD Hourly Chart


    It is now consolidating above the 1.2500 level. On the upside, the pair is facing resistance near the 1.2550 level. The next major hurdle is near the 1.2600 level.

    The 1.618 Fib extension level of the downward move from the 1.2500 swing high to 1.2329 low is also near the 1.2600 zone. An upside break above 1.2600 could set the pace for a move towards the 1.2720 resistance zone.

    If there is no upside break above 1.2600, the pair could start a fresh decline. An immediate support is near the 1.2500. The next major support is near the 1.2450 level.

    There is also a key bullish trend line forming with support near 1.2465 on the hourly chart of GBP/USD. If there is a break below the 1.2450 support, the pair could test the 1.2320 support.

    Read Full on FXOpen Company Blog...

  10. #420
    Junior Member FXOpen Trader's Avatar
    Join Date
    Dec 2020
    Location
    Asia
    Posts
    1,769
    ECB Hints At Positive Rates, Sending EUR Higher


    The euro started the trading week on a higher note after the ECB President, Christine Lagarde, said that the central bank is ready to raise the rates during the summer. In a blog posted on the ECB’s website, Lagarde said that the lift-off date is drawing closer, and it is important for the markets to know the policy normalization path ahead.

    Euro needed nothing more to rally. The EUR/USD, as seen below, jumped over 100 pips or more than 1% on the news. Traders now expect that the ECB will raise the key interest rate twice in July and once in September, bringing the deposit facility rate to zero.


    ECB Prepares for the Ending of Negative Rates

    It is a milestone for the ECB. The central bank has kept the interest rate below zero for many years, but now it fears that a weaker currency might add to inflation.

    It is calculated that the euro depreciation since March 2022 alone could add another 10bp on inflation this year and 20bp in the year to come. Hence, the ECB wanted to make sure that the markets know it is not tolerating inflation much higher than its price stability definition.

    As a consequence, the euro rallied across the board. It gained against all its peers, not only against the US dollar.

    But the EUR/USD is the exchange rate that matters. To be able to gain against the dollar at a time when the Fed is hiking the rates aggressively is something to take into account by traders.

    Euro traded as high as 1.23 against the dollar only twelve months ago. The rapid depreciation to below 1.04 worried the ECB, as it fuels higher inflation.

    As such, the news that the central bank plans the normalization of its policy should not come as a surprise, despite the war in Ukraine. ECB has the mandate to deal with price stability, and the only way to do so is to raise the rates to combat inflation.

    All in all, today’s news confirms that the ECB joined the hawkish camp. The big question in the months ahead would be if the summer rate hikes are all the ECB is willing to do, or some more await after September?

    FXOpen Blog

Page 42 of 146 FirstFirst ... 32 40 41 42 43 44 52 92 142 ... LastLast

Bookmarks

Posting Permissions

  • You may not post new threads
  • You may not post replies
  • You may not post attachments
  • You may not edit your posts
  •