
 LinkBack URL
 About LinkBacks


EUR/USD and USD/CHF: Dollar Bulls In Control
EUR/USD is still struggling to gain momentum above the 1.1320 zone. USD/CHF is rising, and it might extend gains above the 0.9250 level.
Important Takeaways for EUR/USD and USD/CHF
- The Euro is trading well below the 1.1320 and 1.1350 resistance levels against the US Dollar.
- There is a key bearish trend line forming with resistance near 1.1288 on the hourly chart of EUR/USD.
- USD/CHF started a decent increase from the 0.9190 support zone.
- There was a break above a major bearish trend line with resistance near 0.9230 on the hourly chart.
EUR/USD Technical Analysis
The Euro attempted an upside break above the 1.1350 resistance zone against the US Dollar. The EUR/USD pair failed to gain strength above 1.1350 and started a fresh decline.
There was a clear break below the 1.1320 and 1.1300 support levels. The pair even broke the 1.1280 support and the 50 hourly simple moving average. It traded as low as 1.1235 on FXOpen and is correcting losses.
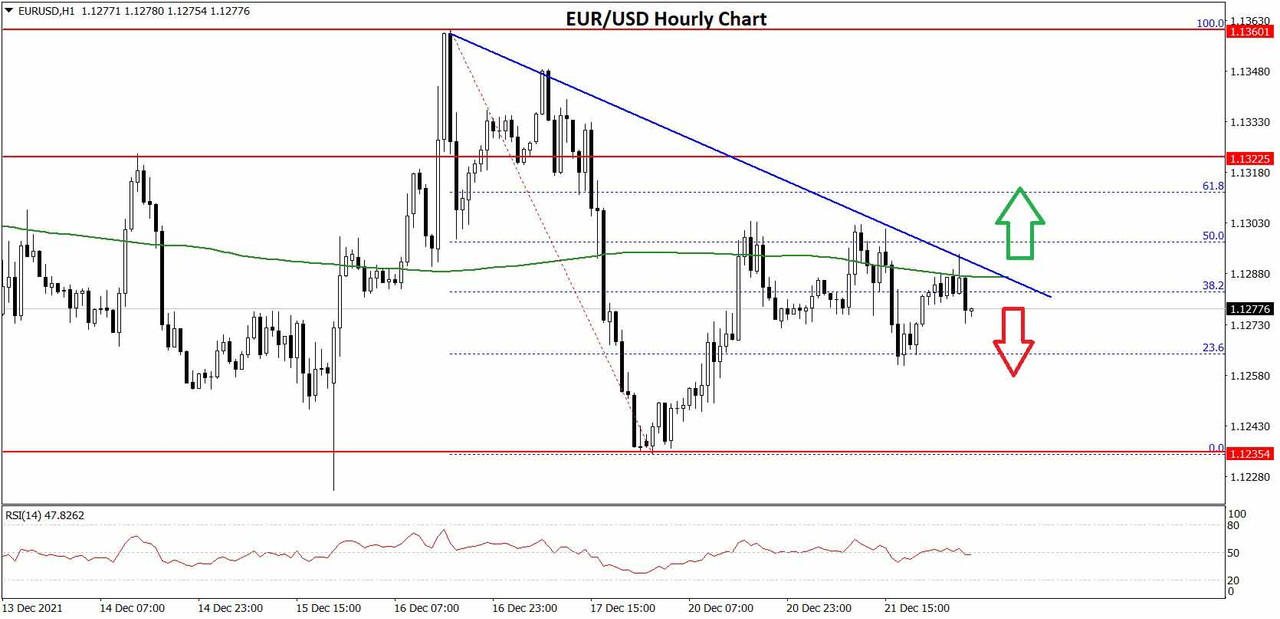
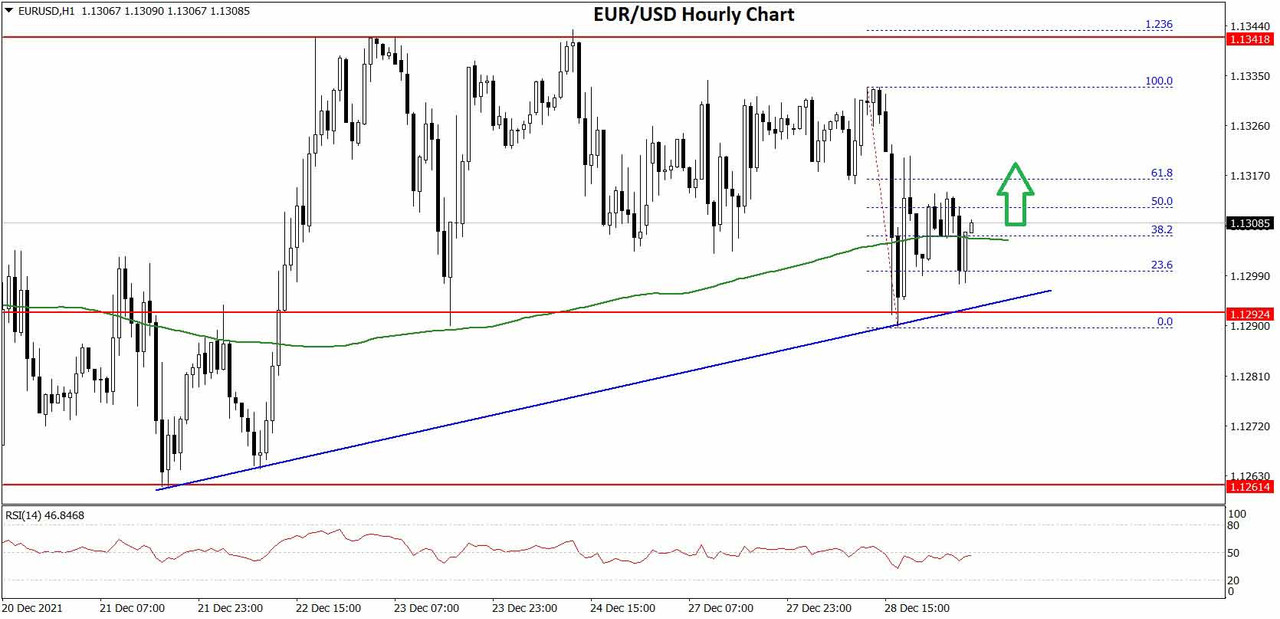
EUR/USD Hourly Chart
On the upside, an initial resistance is near the 1.1285 level. The 38.2% Fib retracement level of the recent drop from the 1.1360 swing high to 1.1235 low is also near 1.1285.
There is also a key bearish trend line forming with resistance near 1.1288 on the hourly chart of EUR/USD. The next major resistance is near the 1.1300 zone. It is near the 50% Fib retracement level of the recent drop from the 1.1360 swing high to 1.1235 low.
A clear upside break above the 1.1300 zone could open the doors for a steady move. The next major resistance sits near the 1.1350 level. On the downside, an immediate support is near the 1.1255 level. The next major support is near the 1.1235 level.
A downside break below the 1.1235 support could start another decline. The next major support sits near 1.1200.
Read Full on FXOpen Company Blog...


 Reply With Quote


Bookmarks