
 LinkBack URL
 About LinkBacks


LTC and EOS Correction could have ended but further confirmation is needed
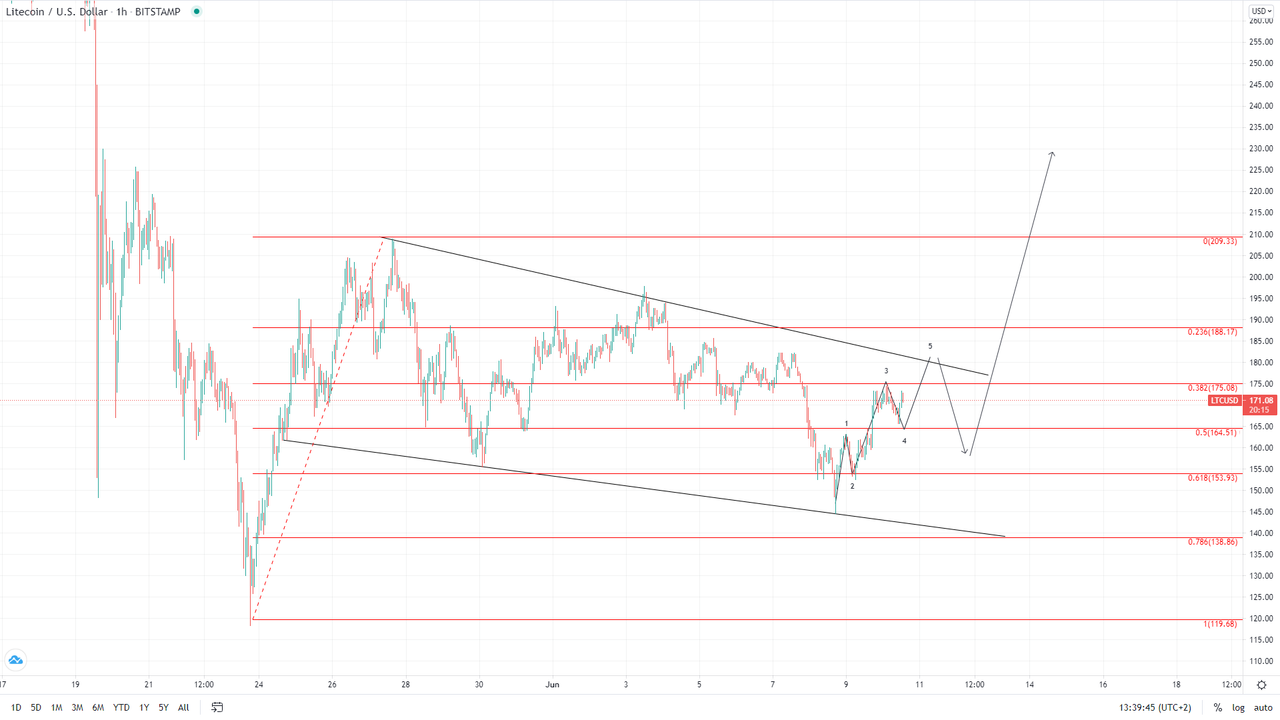
LTC/USD
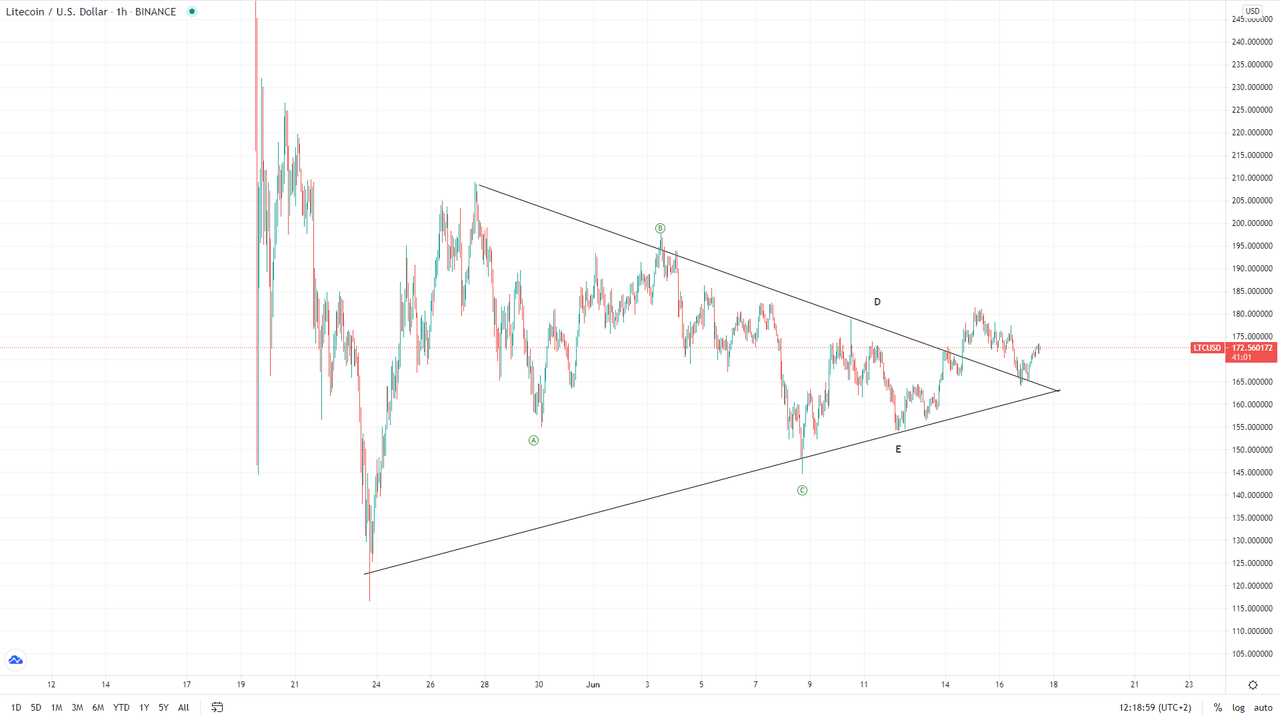
The price of Litecoin has been on the rise since Tuesday when it fell down to $144.36. From there we have seen an increase of 21.5% measured to its highest point today at $175. A minor pullback was made but again a rise with the price currently sitting slightly lower than its highest point today.
On the hourly chart, you can see that the price of Litecoin is still in a descending triangle from the 26th of May. Another interaction with its resistance level could be expected during the day as the 5th wave from the starting five-wave impulse from Tuesday. This could be the start of the higher degree upward move after the three-wave correction ended on the 8th in which case after a retracement we are to see a breakout from the upside.
The picture still looks corrective which is why we could be seeing the 4th wave out of the five-wave correction move from the 26th in which case the price of Litecoin could fall back to a lower low compared to the one on the 8th of June. This is why we are going to see from the interaction with the descending resistance if the price gets rejected and the depth of the expected retracement which scenario would be in play.
If it lands on the 0.5 Fib level or slightly lower and finds support there on the expected retracement that could be an early sign for a potential breakout to the upside.
Read Full on FXOpen Company Blog...


 Reply With Quote


Bookmarks