Page 2 of 145 FirstFirst 1 2 3 4 12 52 102 ... LastLast
Results 11 to 20 of 1448

Daily Market Analysis By FXOpen

This is a discussion on Daily Market Analysis By FXOpen within the Analytics and News forums, part of the Trading Forum category; ECB Disappointed Markets – Why? Last week’s main event, the European Central Bank (ECB) meeting, disappointed the market. The central ...


  1. #11
    Junior Member FXOpen Trader's Avatar
    Join Date
    Dec 2020
    Location
    Asia
    Posts
    1,757
    ECB Disappointed Markets – Why?


    Last week’s main event, the European Central Bank (ECB) meeting, disappointed the market. The central bank pre-committed to ease the financial conditions already from October, but the markets remained with the feeling that the ECB did not do enough.

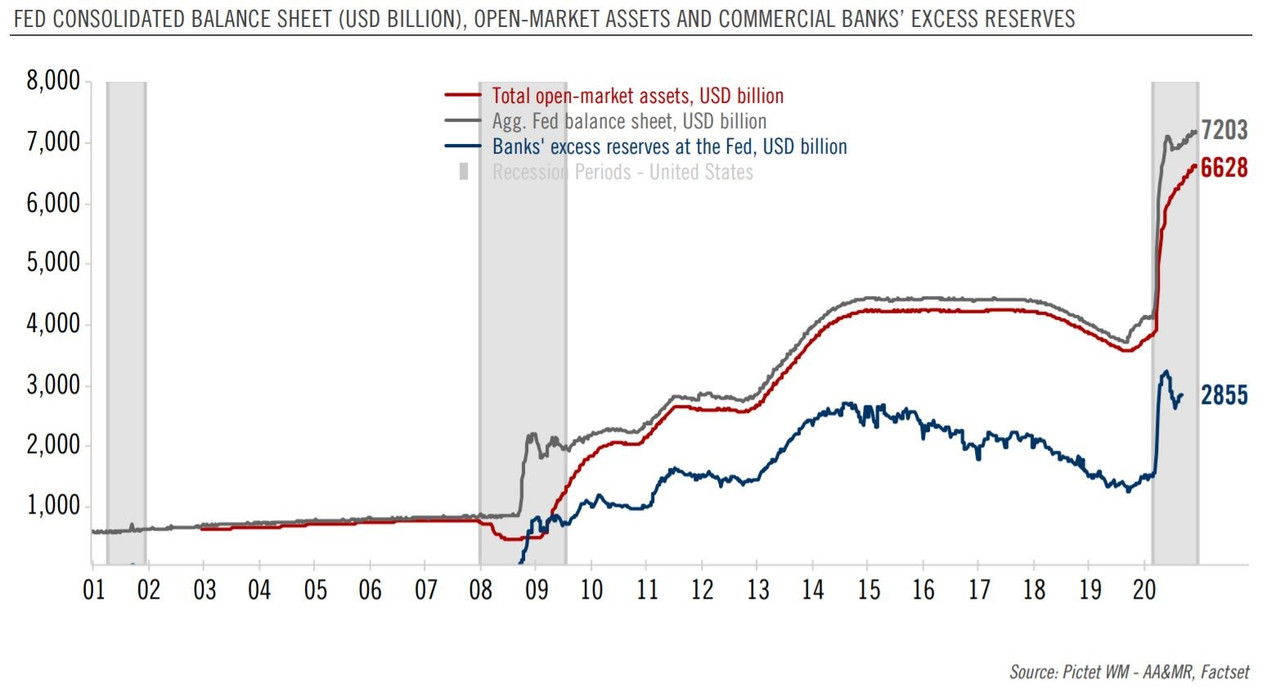
    Yes, the central bank further eased the policy – it extended the Quantitative Easing (QE) program and offered better terms on its TLTROs. However, it was less than the market expected. Moreover, the market pushed the EURUSD exchange rate above the 1.20 level a week before the ECB, and the central bank did not give any clue that it is bothered by the move.


    What Was Priced In?

    The market expected the PEPP program, which basically is the QE program during the pandemic, to be extended by June 2022. Instead, the ECB extended it only by March 2022. The three months between the two dates when the ECB will not buy bonds represent a tightening rather than easing. As such, the market took the message as hawkish rather than dovish.

    Moreover, the new TLTRO conditions for commercial banks to get access to the funds are tougher. In other words, few commercial banks will be able to meet the ECB’s terms so that they will get the funds needed. As a result, the ECB managed to deliver another hawkish message during a dovish statement.

    Finally, the central bank suggested that it expects inflation to reach 1.2% in 2023, using the “core” approach, the one that does not consider energy prices. But that is well below the 2% threshold established by its mandate and may suggest that the ECB has a problem bringing inflation below but close to the target.

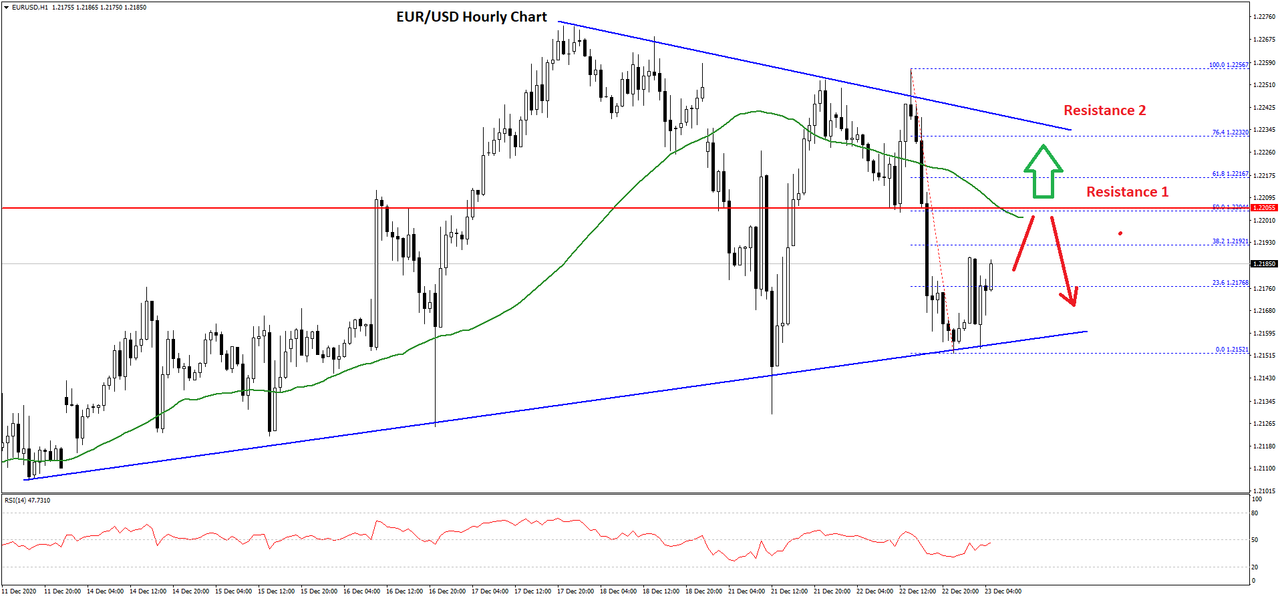
    How About the EURUSD?

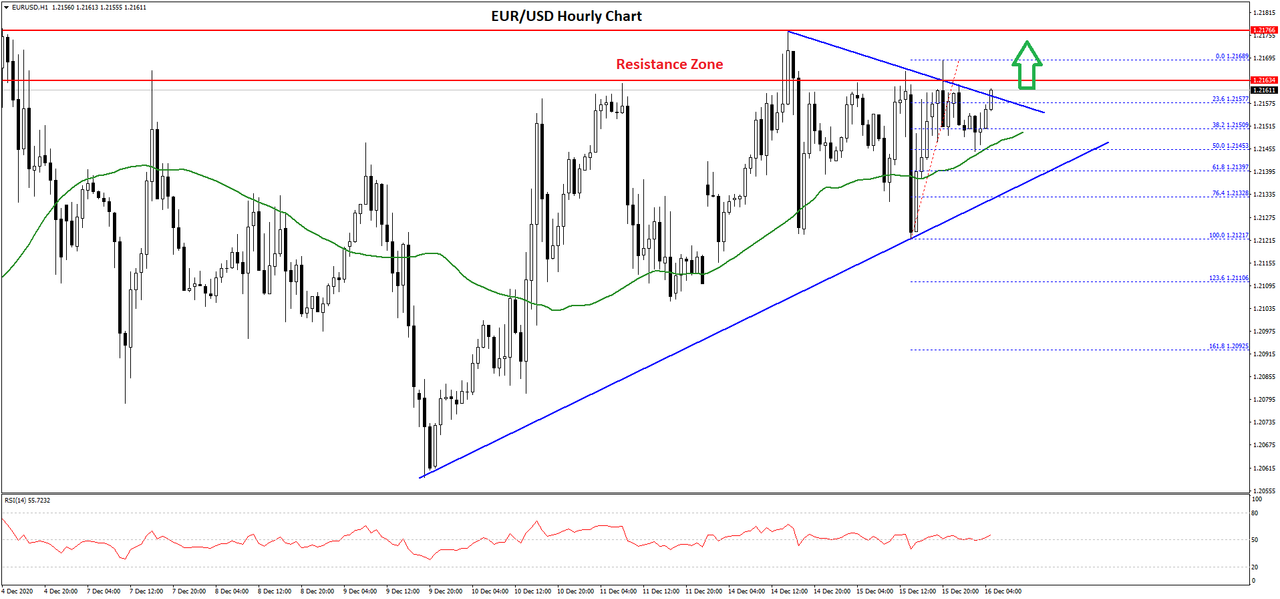
    The EURUSD and a strong Euro represent such a problem. It is economics 101 that a stronger currency weighs on inflation. Thus, the ECB would have an easier task of reaching its inflation-targeting mandate if the Euro will not be that strong. In particular, the EURUSD is an ongoing concern for the ECB.

    However, by only delivering more easing measures wrapped in hawkish statements, the ECB does nothing but fueling a stronger EUR. As such, we should not be surprised by the fact that the EURUSD rate at the 2020 highs two days after the ECB press conference ended.

    FXOpen Blog

  2. #12
    Junior Member FXOpen Trader's Avatar
    Join Date
    Dec 2020
    Location
    Asia
    Posts
    1,757
    BTC encounters resistance while XRP finds support


    BTC/USD

    The price of Bitcoin has been increasing from last Friday when it was sitting at $17,570 at its lowest point and came up by around 11.4% measured to its highest point today at $19,570. Now the price is being traded at $19,316 as it fell from today’s high and is now making a recovery.


    On the hourly chart, you can see that this is a struggle for the price to keep up its bullish momentum above the lower horizontal level at $19,191 which represents the daily candle close from the 2017 all-time high. Since the start of the month, we have seen the price in a decline, forming a descending channel from the 1st of December. Last Friday the price found support on the 0.618 Fib level and started increasing again, breaking out from this descending formation and coming above the significant lower horizontal level.

    Now as the price is getting close to the vicinity of the high made on December 1st it has started moving sideways which indicates that resistance has been found. If this is the uptrend continuation after the descending channel was a higher degree retracement, the price is now headed towards is higher high, effectively making a new all-time high. But first, it needs to break this resistance zone in between the two horizontal resistance levels, so we are yet to see if the price manages to do so.

    If the price gets rejected once more at this range we could see a lower low compared to the one made last Friday which would mean that the corrective move from the 26th of November hasn’t developed fully, but if it manages to surpass the $19,677 level it would indicate that is headed toward the $21,000 mark.

    XRP/USD

    The price of Ripple has been on a decline since the start of the month, coming down from $0.68 at its highest to $0.47656 at its lowest point today, which is a decrease of around 30%. Currently the price is being traded at $0.4839 but is still in a downward trajectory.


    Looking at the hourly chart, we can see that the price has formed a significant corrective pattern from the 24th of November when it spiked to $0.79. First, we have seen a three-wave descending move with strong momentum, followed by a three-wave upward ABC a bit less steep, and after that a five-wave move to the downside which was developed slowly and wasn’t impulsively developed. These movements are constituting a higher degree WXY correction, which if we are now seeing the E from the five-wave move ABCDE correction is coming to a completion.

    There is still a bit more room to go to the downside, to the interrupted support level and the $0.46 low made on the 26th of November before the correction ends, but after it does it would be expected that the price of Ripple continue moving to the upside again in an impulsive manner and potentially surpass its November’s high.

    FXOpen Blog

  3. #13
    Junior Member FXOpen Trader's Avatar
    Join Date
    Dec 2020
    Location
    Asia
    Posts
    1,757
    EUR/USD Approaching Key Resistance, USD/CHF Remains At Risk


    EUR/USD is trading in a positive zone above 1.2100, but it is facing hurdles near 1.2170. USD/CHF is struggling to hold the 0.8850 support and it could decline heavily.

    Important Takeaways for EUR/USD and USD/CHF
    • The Euro started a fresh increase above the 1.2050 and 1.2100 resistance levels against the US Dollar.
    • There is a connecting bullish trend line forming with support near 1.2140 on the hourly chart of EUR/USD.
    • USD/CHF remains in a bearish zone below the 0.8950 and 0.8920 resistance levels.
    • There are two major bearish trend lines forming with resistance near 0.0.8870 on the hourly chart.


    EUR/USD Technical Analysis

    In the past few days, the Euro remained in a positive zone above the 1.2050 support zone against the US Dollar. The EUR/USD pair gained pace above the 1.2100 resistance to move into a positive zone.

    The upward move was such that the pair broke the 1.2120 resistance and settled above the 50 hourly simple moving average. However, the pair seems to be facing a strong resistance near the 1.2165 and 1.2170 levels.


    The recent high was formed near 1.2168 on FXOpen before there was a downside correction. There was a break below the 1.2155 level, and the pair traded below the 23.6% Fib retracement level of the upward move from the 1.2121 low to 1.2168 high.

    The decline found support near the 1.2145 and the 50 hourly simple moving average. The 50% Fib retracement level of the upward move from the 1.2121 low to 1.2168 high is also acting as a support.

    There is also a connecting bullish trend line forming with support near 1.2140 on the hourly chart of EUR/USD. On the upside, the pair could gain bullish momentum once it clears the 1.2165 and 1.2170 resistance levels.

    Conversely, there is a risk of a downside break below the trend line and 1.2145. The next major support is near the 1.2120 level. Any more losses could spark a major decline below the 1.2100 support zone in the coming sessions.

    USD/CHF Technical Analysis

    The US Dollar started a major decline below the 0.8950 support zone against the Swiss franc. The USD/CHF pair even settled below the 0.8900 level to move into a bearish zone.

    The decline gained pace below the 0.8880 level and the 50 hourly simple moving average. The pair is now consolidating above the 0.8850 support level, with a bearish angle. The recent low was formed near 0.8850 before the pair corrected above the 23.6% Fib retracement level of the recent decline from the 0.8878 high to 0.8850 low.


    On the upside, an initial resistance is near the 0.8865 level and the 50 hourly simple moving average. The 50% Fib retracement level of the recent decline from the 0.8878 high to 0.8850 low is also near 0.8865.

    More importantly, there are two major bearish trend lines forming with resistance near 0.0.8870 on the hourly chart. The pair must climb above 0.8865 and 0.8870 to increase the chances of a decent recovery.

    The next major resistance is near the 0.9000 and 0.9005 levels. Conversely, a clear break below the 0.8850 support may perhaps open the doors for a larger decline.

    The next major support is near the 0.8820 level, below which the pair could test 0.8800. Any further losses could lead USD/CHF towards the 0.8750 support level in the near term.

    FXOpen Blog

  4. #14
    Junior Member FXOpen Trader's Avatar
    Join Date
    Dec 2020
    Location
    Asia
    Posts
    1,757
    LTC and EOS – Consolidation Expected Before Further Upside


    LTC/USD

    The price of Litecoin has been increasing since the start of the week and from Monday’s low at $79.215 we have seen a rise of 29.75% measured to its highest point today at $102.781. Currently, the price is being traded slightly lower as a minor pullback was made and is sitting just below the $100 mark.


    On the hourly chart, you can see that Monday’s low was a corrective move made after the interaction with the $84 horizontal level which was the end of the first impulse wave out of a five-wave move that started on the 11th. The second wave established support on the $78.44 level from which we have seen a parabolic rise with the price breaking significant resistance with a strong bullish moment.

    As this increase was the 3rd wave which appears completed as it can be sub-divided in lower degree five-wave count, we are now likely to see a pullback to around $92 where the prior local resistance level might get tested for support. But after the pullback ends further upside movement would be expected and a higher high compared to today’s one. This expected increase would be the 5th wave that is set to push the price for a higher high and potentially to the $109.35 where the next significant horizontal resistance level is.

    EOS/USD

    From Monday’s low at $2.8 the price has increased by 13.46% as it came up to $3.182 at its highest point today. It is still in an upward trajectory and is showing strong bullish momentum.


    Looking at the hourly chart, you can see that the price made a breakout above the $2.9 resistance zone with a significant rise made in one hour and continued moving to the upside, further increasing inside the upper range. Like in the case of Litecoin, this increase seen from Monday is the 3rd wave out of the next five-wave impulse to the upside. Today we have seen a spike to the downside but shortly after the price continued increasing from which we can see that an attempt for the support to be established has successfully done.

    Now we are likely to see the 3rd wave ending its development which is why shortly a corrective 4th wave would start. This would only be a minor consolidation before further upside movement as the 5t wave would follow to develop but it is still uncertain where the 3rd wave could end. Considering the vicinity of the $3.27 horizontal level we might see interaction with it before the end of the current inrease. But in either way the price of EOS would be expected to surpass it before the completion of the entire five-wave rise.

    FXOpen Blog

  5. #15
    Junior Member FXOpen Trader's Avatar
    Join Date
    Dec 2020
    Location
    Asia
    Posts
    1,757
    AUD/USD and NZD/USD Set New Multi-Month Highs, Dips Likely Limited


    AUD/USD extended its rise above 0.7500 and traded to a new multi-month high above 0.7600. NZD/USD also followed a similar path and climbed towards the 0.7200 zone.

    Important Takeaways for AUD/USD and NZD/USD

    • The Aussie Dollar gained pace above the 0.7500 and 0.7550 resistance levels against the US Dollar.
    • There is a major contracting triangle forming with resistance near 0.7620 on the hourly chart of AUD/USD.
    • NZD/USD climbed higher nicely and surpassed the 0.7150 resistance level.
    • A key bullish trend line is forming with support near 0.7100 on the hourly chart of NZD/USD.


    AUD/USD Technical Analysis

    In the past few weeks, the Aussie Dollar followed a bullish path after a proper close above 0.7350 against the US Dollar. The AUD/USD pair even broke the 0.7500 resistance level to move into a positive zone.

    The upward move gained pace above the 0.7550r resistance and the pair settled well above the 50 hourly simple moving average. The pair even spiked above the 0.7600 level and it traded to a new multi-month high at 0.7639.


    Recently, there was a minor downside correction below the 0.7620 level. The pair traded below the 23.6% Fib retracement level of the recent increase from the 0.7538 swing low to 0.7639 high.

    The pair is now testing the 0.7600 support level. There is also a major contracting triangle forming with resistance near 0.7620 on the hourly chart of AUD/USD. The triangle support is near the 0.7600 zone and acting as a strong support.

    The next major support is near the 0.7590 level and the 50 hourly simple moving average. The 50% Fib retracement level of the recent increase from the 0.7538 swing low to 0.7639 high is also near the 0.7590 level to provide support.

    If there are more losses and a downside break below 0.7575-0.7580, the pair could extend losses towards the 0.7550 support. Conversely, the pair could start a fresh increase above the 0.7620 resistance zone.

    The first major resistance is near the 0.7640 level, above which AUD/USD could accelerate higher towards the 0.7680 level.

    NZD/USD Technical Analysis

    The New Zealand Dollar also followed a bullish path above the 0.7000 pivot level against the US Dollar. The NZD/USD pair even surged above the 0.7100 resistance zone.

    The pair climbed above the 0.7150 level and settled well above the 50 hourly simple moving average. It traded to a new multi-month high at 0.7170 before starting a downside correction.


    There was a break below the 0.7150 level. The pair even broke the 23.6% Fib retracement level of the upward move from the 0.7053 swing low to 0.7170 high. The pair is now approaching the key 0.7120 support level and the 50 hourly simple moving average.

    There is also a key bullish trend line is forming with support near 0.7100 on the hourly chart of NZD/USD. The trend line is close to the 50% Fib retracement level of the upward move from the 0.7053 swing low to 0.7170 high.

    If there is a downside break below the trend line support, there is a risk of more losses towards the 0.7080 and 0.7050 support levels. Conversely, the pair could start a fresh increase above the 0.7150 and 0.7160 resistance levels.

    FXOpen Blog

  6. #16
    Junior Member FXOpen Trader's Avatar
    Join Date
    Dec 2020
    Location
    Asia
    Posts
    1,757
    GBP/USD Corrects Lower, USD/CAD Extending Gains


    GBP/USD started a fresh decline after testing the 1.3625 zone. USD/CAD is rising and it is showing a lot of positive signs above the 1.2800 level.

    Important Takeaways for GBP/USD and USD/CAD
    • The British Pound started a fresh downside correction from the 1.3624 high.
    • There was a break below a major bullish trend line with support near 1.3530 on the hourly chart of GBP/USD.
    • USD/CAD started a strong increase from the 1.2700 support zone and climbed above 1.2800.
    • There was a break above a key bearish trend line with resistance near 1.2740 on the hourly chart.


    GBP/USD Technical Analysis

    This past week, the British Pound gained momentum above the 1.3500 resistance level against the US Dollar. The GBP/USD pair broke the 1.3550 and 1.3560 resistance levels to move into a positive zone.

    The pair even broke the 1.3600 resistance and traded as high as 1.3624 on FXOpen. This week, it opened with a gap lower and traded below the 1.3520 support zone. There was a close below the 1.3500 level and the 50 hourly simple moving average.


    Moreover, there was a break below a major bullish trend line with support near 1.3530 on the hourly chart of GBP/USD. The pair even traded below the 50% Fib retracement level of the upward move from the 1.3134 swing low to 1.3624 high.

    An immediate support is near the 1.3320 level. It is close to the 61.8% Fib retracement level of the upward move from the 1.3134 swing low to 1.3624 high.

    The next major support is near the 1.3280 level. If there are more downsides, the pair could dive towards the 1.3200 support zone in the near term. On the upside, an initial resistance level is near the 1.3400 level.

    The main resistance is now forming near the 1.3500 zone and 50 hourly simple moving average. A close above 1.3500 could open the doors for a push towards the 1.3624 high.

    USD/CAD Technical Analysis

    The US Dollar formed a strong support base near 1.2700 and started a fresh increase against the Canadian Dollar. The USD/CAD pair broke many important hurdles near 1.2750 to move into a positive zone.

    There was also a break above a key bearish trend line with resistance near 1.2740 on the hourly chart. The pair settled nicely above the 1.2800 level and the 50 hourly simple moving average.


    It even spiked above 1.2850 and traded as high as 1.2854. It is currently consolidating gains above the 1.2820 support level. An initial support is near the 1.2835 level. It is close to the 23.6% Fib retracement level of the recent wave from the 1.2775 swing low to 1.2854 high.

    The main support is forming near the 1.2815 level. It is close to the 50% Fib retracement level of the recent wave from the 1.2775 swing low to 1.2854 high. Any more losses might call for a break below the 1.2800 support zone.

    On the upside, the 1.2850 level is a key resistance. Therefore, a successful break and close above the 1.2850 resistance level could spark another strong upward move.

    The next key resistance is near the 1.2885 level, above which the bulls are likely to target more upsides above the 1.2900 level.

    FXOpen Blog

  7. #17
    Junior Member FXOpen Trader's Avatar
    Join Date
    Dec 2020
    Location
    Asia
    Posts
    1,757
    Financial Markets at Risk as the Virus Locks Europe Down


    The markets opened with a bearish tone as there is a new turn of events on the pandemic course. Over the weekend, the news that a new virus’ variant circulates in the United Kingdom caused panic in Europe. According to the UK authorities, the new variant spreads faster, and that poses a risk for the period ahead.

    Quickly after the announcement, several European countries suspended their flights to the United Kingdom, in a move that signals the harsh lockdown in place in Europe. As such, the market is at risk of declining due to the lack of liquidity characteristic this time of the year.


    The Fed Remains Dovish

    Last week’s main event was the Federal Reserve meeting and interest rate decision. The Fed chooses to do nothing at this meeting, but it kept a dovish tone.

    During the press conference, the Fed’s Chair Powell said that the central bank reopened the USD swap lines and that it will keep the Quantitative Easing (QE) program at the same pace of $120 billion. Much of the focus of last week’s meeting was to see if the Fed hints at changing the focus of the bond-buying. So far, the focus was on shorter-term maturities, but rumors in the market suggested that the Fed may switch to longer-term maturities.

    By targeting longer-term bonds, the Fed aims at lowering the yields further, in a move destined to ease financial conditions even more. However, it did not do so, but it hinted that it represents a tool it may use in the future.

    Risk-Off Market Moves

    Moving forward, there is the danger of a risk-off move that could grip markets this week. In a risk-off, the USD rises, and the stock market falls. Risk-off market moves are coordinated and have the tendency to affect all markets in a correlated manner. In other words, it does not matter what market one is trading, as they are all affected.

    Because the USD is the world’s reserve currency, how it trades this week is key to risk. As such, expect a more volatile trading week than otherwise.

    FXOpen Blog

  8. #18
    Junior Member FXOpen Trader's Avatar
    Join Date
    Dec 2020
    Location
    Asia
    Posts
    1,757
    BTC and XRP – Correction developing but for how long?


    BTC/USD

    The price of Bitcoin has continued increasing from last week and came to $24,310 at its highest points yesterday from which it decreased by 10.11% at first, but is now making a recovery and is currently sitting at $23,478 level. This minor pullback we have seen yesterday could have been the beginning of the higher degree descending move as the prior impulse to the upside ended but since the price is starting to increase again we are yet to see.


    On the hourly chart, you can see that it came up in a five-wave manner from the 11th of December when it was sitting at $17,500 at its lowest point which was a higher low compared to the one made on the 26th of November.

    This higher lower could have been the ending point of the corrective 4th wave from the higher degree in which case the price has formed now the 5th wave. In that case, we are now to see the start of the descending move, but another possibility would be that this higher low on the 11th was the 2nd sub-wave of the new higher degree impulse. If the second is true, then the five-wave impulse from the 11th is the 3rd wave which means that the current corrective structure is the 4th wave and that the price is going to continue increasing again after.

    Now as the price is making a recovery we are going to see the validation of either scenario from its behavior. If it manages to exceed yesterday’s high it would indicate that another increase is going to the develop before the starting higher degree decline, but if finds resistance here and starts decreasing again it would mean that the increase ended.

    XRP/USD

    The price of Ripple has been in a decline from the 17th of December when it was sitting at $0.66413 and fell to $0.4509 today, which is a decrease of 32.1% but has since started making a minor recovery and is currently sitting at $0.4943.


    Looking at the hourly chart, we can see that the price made an impulsive rise after the completion of the descending triangle like expected and has broken out above the prior lower high. This was a bullish sign but however, it made it back to the same levels from which it started its upward trajectory.

    This could indicate that the correction is still in place with the previous impulsive rise being the second wave X from the prolonged WXYXZ complex correction. If this is true then the price is now going to make another lower low for the development of the Z wave.

    Another possibility could be that this is another starting five-wave impulse with the last decline being its 2nd sub-wave.

    FXOpen Blog

  9. #19
    Junior Member FXOpen Trader's Avatar
    Join Date
    Dec 2020
    Location
    Asia
    Posts
    1,757
    EUR/USD and USD/JPY Approaching Next Crucial Breakout


    EUR/USD corrected lower after it struggled to clear the 1.2250 resistance level. USD/JPY is trading above 103.20 and it is likely setting up for the next major move.

    Important Takeaways for EUR/USD and USD/JPY

    • The Euro seems to be facing a strong resistance near 1.2250 and 1.2260.
    • There is a major bullish trend line forming with support near 1.2160 on the hourly chart of EUR/USD.
    • USD/JPY is rising steadily and it is well above the 103.20 support level.
    • There is a key contracting triangle forming with support near 103.45 on the hourly chart.


    EUR/USD Technical Analysis

    In the past few days, there were swing moves in the Euro above 1.2200 against the US Dollar. The EUR/USD pair made a couple of attempt to gain strength above 1.2250 and 1.2260, but it failed.

    The recent swing high was formed near 1.2256 on FXOpen before the price started a fresh decline. There was a break below the 1.2200 support level and the 50 hourly simple moving average. The pair even broke the 1.2180 support, but it stayed above the 1.2150 zone.


    A low is formed near 1.2152 and the pair is currently rising. It broke the 23.6% Fib retracement level of the recent decline from the 1.2256 high to 1.2152 low.

    On the upside, the first major resistance is near the 1.2200 level and the 50 hourly simple moving average. The 50% Fib retracement level of the recent decline from the 1.2256 high to 1.2152 low is also near 1.2205.

    A clear break above the 1.2200 resistance zone could lead the pair towards the main 1.2230 level and a connecting bearish trend line. Any more upsides might increase the chances of a break above 1.2260.

    Conversely, the pair could start a fresh decline below the 1.2165 support. The main support is near the 1.2150 zone, and a major bullish trend line forming with support near 1.2160 on the hourly chart of EUR/USD. A break below the trend line support could lead the pair towards the 1.2100 level.

    USD/JPY Technical Analysis

    The US Dollar started a fresh increase from the 103.00 support zone against the Japanese Yen. The USD/JPY pair broke the 103.20 zone to move into a positive zone.

    The pair even broke the 103.50 level and the 50 hourly simple moving average. The recent high was formed near 103.73 before the pair started a downside correction.


    There was a break below the 103.55 level. The pair also declined below the 50% Fib retracement level of the upward move from the 103.31 low to 103.73 high. It is now trading near a major support at 103.45. There is also a key contracting triangle forming with support near 103.45 on the hourly chart.

    If there is a downside break below the trend line, there is a risk of a larger decline towards the 103.20 and 103.00 levels.

    On the upside, the first major resistance is near the 103.65 level. A clear break above the 103.65 zone is needed to start a steady rise towards the 104.00 and 104.20 levels.

    Any more gains could lead the USD/JPY pair towards the 104.50 level, where the bulls are likely to face a strong resistance in the near term.

    FXOpen Blog

  10. #20
    Junior Member FXOpen Trader's Avatar
    Join Date
    Dec 2020
    Location
    Asia
    Posts
    1,757
    GBP/USD and GBP/JPY: British Pound Gains Bullish Momentum


    GBP/USD started a strong increase above the 1.3500 resistance zone. GBP/JPY also gained traction and it gained pace above the 140.00 resistance zone to move into a positive zone.

    Important Takeaways for GBP/USD and GBP/JPY

    • The British Pound climbed higher above the 1.3500 and 1.3550 resistance levels.
    • There is a key bullish trend line forming with support near 1.3555 on the hourly chart of GBP/USD.
    • GBP/JPY also climbed higher steadily above the 139.50 and 140.00 resistance levels.
    • There is a major bullish trend line forming with support near 140.30 on the hourly chart.


    GBP/USD Technical Analysis

    This past week, the British Pound saw a strong increase from the 1.3300 support zone against the US Dollar. The GBP/USD pair broke the 1.3500 resistance zone to move further into a positive zone.

    The upward move was such that the pair even broke the 1.3550 resistance and settled above the 50 hourly simple moving average. It traded as high as 1.3618 on FXOpen and it is currently consolidating gains.


    It corrected lower towards 1.3520 and traded as low as 1.3522. Recently, there was a minor increase above the 1.3540 level. The pair climbed above the 1.3550 level, and tested the 50% Fib retracement level of the recent decline from the 1.3618 high to 1.3522 low.

    The first major resistance is near the 1.3580 level. It is close to the 61.8% Fib retracement level of the recent decline from the 1.3618 high to 1.3522 low.

    On the upside, a clear break above the 1.3600 resistance level is needed for more upsides. The next major resistance is near the 1.3650 level, above which the pair could rise towards the 1.3680 and 1.3700 levels.

    On the downside, there is a key bullish trend line forming with support near 1.3555 on the hourly chart of GBP/USD. If there is a downside break below the trend line support, the pair could continue to move down towards the 1.3500 support level in the near term.

    GBP/JPY Technical Analysis

    The British Pound also climbed nicely from the 137.50 support level against the Japanese Yen. The GBP/JPY pair climbed above the 138.50 level to start a steady increase.

    It gained pace above the 139.20 resistance and settled above the 50 hourly simple moving average. It even spiked above the 141.00 level and traded as high as 141.21 before correcting lower. There was a break below the 140.50 support level.


    However, the pair remained stable above 140.00 and a low is formed near 140.07. The pair is currently rising and trading above the 23.6% Fib retracement level of the recent decline from the 141.21 high to 140.07 low.

    The pair is now facing hurdles near the 140.50 and 140.60 levels. The 50% Fib retracement level of the recent decline from the 141.21 high to 140.07 low is also near the 140.60 zone.

    A clear break above the 140.60 resistance could open the doors for a fresh increase. In the stated case, the pair could rise above the 141.00 and 141.20 resistance levels.

    On the downside, there is a major bullish trend line forming with support near 140.30 on the hourly chart. If there is a downside break below the trend line support, GBP/JPY could retest the 138.50 support level.


    FXOpen Blog

Page 2 of 145 FirstFirst 1 2 3 4 12 52 102 ... LastLast

Bookmarks

Posting Permissions

  • You may not post new threads
  • You may not post replies
  • You may not post attachments
  • You may not edit your posts
  •