
 LinkBack URL
 About LinkBacks


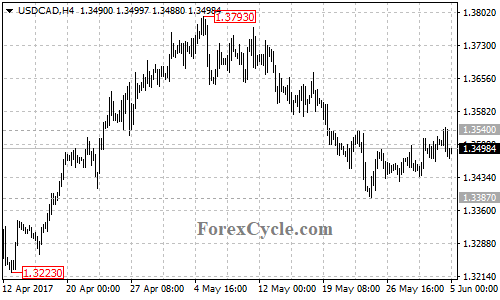
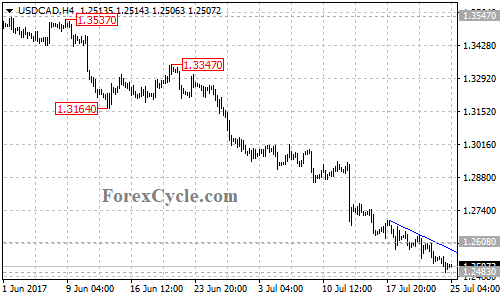
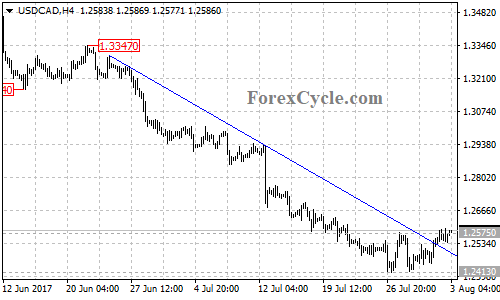
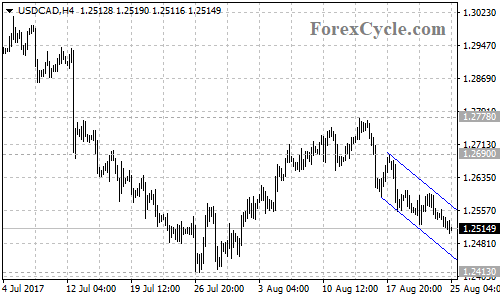
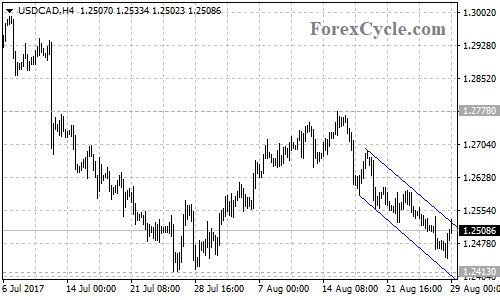
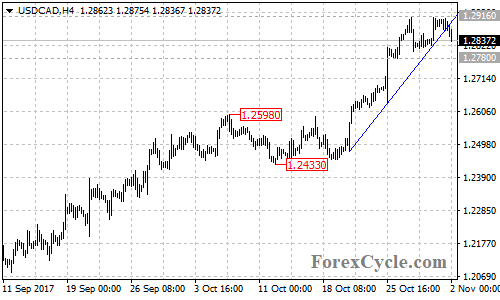
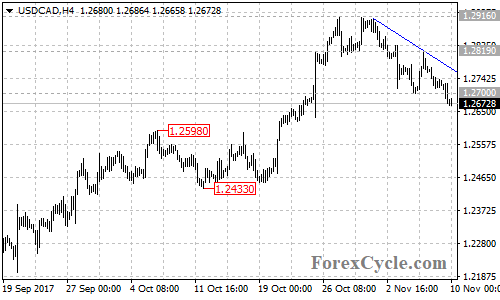
After touching 1.3540 resistance, USDCAD pulled back to 1.3480, indicating that the pair remains in downtrend from 1.3793 and the bounce from 1.3387 could be treated as consolidation of the downtrend. As long as 1.3540 resistance holds, the downtrend could be expected to continue and further decline towards 1.3200 is still possible after the consolidation. Only a clear break of 1.3540 resistance will indicate that the bearish movement had completed at 1.3387 already, this could trigger another rise towards 1.3800.


 Reply With Quote


Bookmarks