Page 58 of 70 FirstFirst ... 8 48 56 57 58 59 60 68 ... LastLast
Results 571 to 580 of 698
Like Tree1Likes

Tifia Daily Market Analytics

This is a discussion on Tifia Daily Market Analytics within the Analytics and News forums, part of the Trading Forum category; GBP/USD: the pound does not want to decline 10/21/2019 The pound and GBP / USD have been rising since the ...


  1. #571
    Senior Member TifiaFX's Avatar
    Join Date
    Mar 2017
    Posts
    697
    GBP/USD: the pound does not want to decline
    10/21/2019

    The pound and GBP / USD have been rising since the beginning of this month and for the 4th week in a row, receiving support from the reduced risks of the “hard” Brexit. Despite the fact that Boris Johnson on Saturday failed to secure the support of the British Parliament regarding his Brexit deal, the pound did not lose a positive impulse. The members of parliament decided that a decisive vote can only be held after a thorough examination of all related legislation, which can take a considerable amount of time.
    Johnson obeyed the decision of the Parliament, but in a separate letter addressed to the President of the European Council, Donald Tusk, asked the EU leaders to reject his own motion.
    Despite the pound falling during the Asian session, at the beginning of the European session on Monday, the GBP / USD pair is growing again, rising to the level of 1.3011.
    This week Johnson will again try to enlist the support of a sufficient number of legislators to approve the agreement. However, the likelihood of a hard Brexit is significantly reduced.
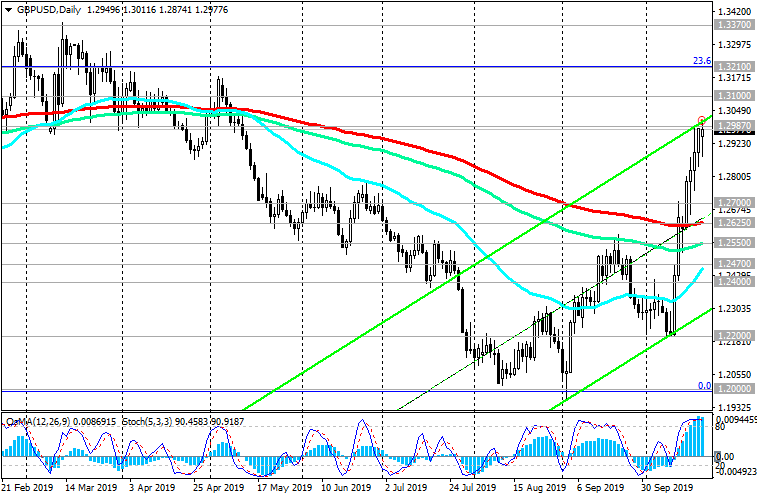
    Earlier in October, GBP / USD broke through an important resistance level of 1.2625 (EMA200 on the daily chart) and today reached a new 5-month high near 1.3011,
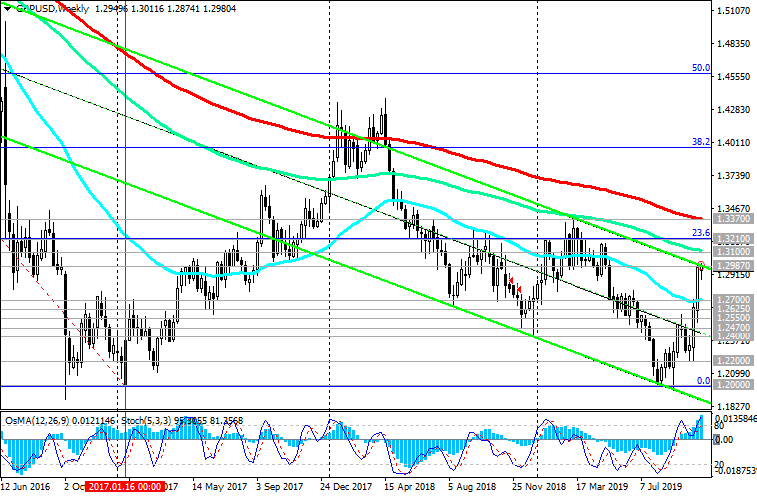
    through which the upper boundary of the descending channel passes on the weekly chart.
    A breakthrough of this resistance level will open the way for the growth of GBP / USD to the zone of resistance levels of 1.3100 (EMA144 on the weekly chart), 1.3210 (Fibonacci level 23.6% of the correction to the reduce the GBP / USD pair in a wave that began in July 2014 near the level of 1.7200) , 1.3370 (EMA200 on the weekly chart).
    In an alternative scenario, a return to the zone below 1.2625 will indicate the resumption of the bearish trend of GBP / USD. The current goal of the decline is the support level of 1.2000 (2017 lows and the Fibonacci level of 0%).
    So far, a positive impetus prevails, however, short positions below the support level of 1.2625 will again be preferred.
    Support Levels: 1.2800, 1.2700, 1.2625, 1.2550, 1.2470, 1.2400, 1.2200, 1.2100, 1.2000
    Resistance Levels: 1.3000, 1.3100, 1.3210, 1.3370

    Trading Scenarios

    Sell Stop 1.2870. Stop-Loss 1.3020. Take-Profit 1.2800, 1.2700, 1.2625, 1.2550, 1.2470, 1.2400, 1.2200, 1.2100, 1.2000
    Buy Stop 1.3020. Stop-Loss 1.2870. Take-Profit 1.3100, 1.3210, 1.3370


    *) For up-to-date and detailed analytics and news on the forex market visit Tifia Forex Broker website tifia.com

  2. #572
    Senior Member TifiaFX's Avatar
    Join Date
    Mar 2017
    Posts
    697
    AUD/USD: the fall of the US dollar has stopped
    10/22/2019

    Australia's unemployment rate dropped in September (to 5.2% from 5.3% in August), while consumer confidence in the country rose 0.6% last week after falling 1.2% the previous week.
    At the same time, economists expect Australia's labor market and core inflation to weaken in the coming months.
    The International Monetary Fund has lowered its forecast for the Australian economy, which against the backdrop of worsening economic data in China is a negative factor for investors betting on the further growth of the Australian currency.
    Some market participants believe that the RBA may again lower the rate to 0.25% at the beginning of 2020, as well as launch a quantitative easing program.
    Meanwhile, the fall of the US dollar has stopped. Futures on the DXY dollar index is growing, trading at the beginning of the European session near 97.11, 8 points higher than the opening price at the beginning of today's trading day.
    "The development of a trade agreement with China is progressing very well", said Donald Trump on Monday, and Chinese Deputy Foreign Minister Le Yucheng said the parties have made some progress in the negotiations.
    Investors hope that the United States and China may be moving towards a preliminary agreement, despite the persistence of unresolved disagreements on issues such as protecting intellectual property and subsidizing agricultural producers in China.
    AUD / USD remains in a long-term downtrend, continuing to trade in the zone below the key resistance level of 0.6950 (ЕМА200 on the daily chart).
    The breakdown of the short-term support level of 0.6810 (ЕМА200 on the 1-hour chart) will be the first signal to resume the sales of AUD / USD.
    In this case, the targets will be the support levels 0.6680, 0.6600. The distant target is located at support levels of 0.6260, 0.6000 (lows of 2008 - 2009).
    In any case, from a technical point of view, the correctional growth of AUD / USD will be limited by the resistance levels of 0.6895 (EMA144 on the daily chart and September highs), 0.6950 (EMA200 on the daily chart).
    Support Levels: 0.6830, 0.6810, 0.6790, 0.6745, 0.6700, 0.6680, 0.6600, 0.6300
    Resistance Levels: 0.6875, 0.6895, 0.6950

    Trading Recommendations

    Sell by market. Sell-Limit 0.6890. Stop-Loss 0.6910. Take-Profit 0.6830, 0.6810, 0.6790, 0.6745, 0.6700, 0.6680, 0.6600, 0.6300
    Buy Stop 0.6910. Stop-Loss 0.6850. Take-Profit 0.6950


    *) For up-to-date and detailed analytics and news on the forex market visit Tifia Forex Broker website tifia.com

  3. #573
    Senior Member TifiaFX's Avatar
    Join Date
    Mar 2017
    Posts
    697
    EUR/USD: Current Dynamics
    10/23/2019

    Amid the weakening US dollar, EUR / USD was able to grow significantly this month, reaching on Monday a new 10-week high near 1.1180. However, below the key resistance levels of 1.1150 (ЕМА144 on the daily chart), 1.1200 (ЕМА200 on the daily chart), a long-term bearish trend remains.
    The small steps taken earlier this month towards a ceasefire in a trade war between China and the US are not enough to ease the uncertainties that are holding back the global economy, and uncertainty has reappeared on the Brexit issue.
    In this regard, the role of the dollar as a protective asset is once again becoming relevant.
    In September, the ECB lowered its key interest rate, which was already in negative territory, and resumed its bond purchase program. The ECB leaders promised to keep these measures in force, "until we see that the inflation prospects are stably in line" with reaching the target level.
    Market participants are preparing for tomorrow's ECB meeting, which will be the last under the leadership of Mario Draghi. From November 1, this post will take Christine Lagarde.
    The ECB's decision on rates will be published on Thursday at 11:45 (GMT), and a press conference following the ECB meeting will begin at 12:30.
    As previously published data showed, the annual inflation rate in the Eurozone in September slowed to 0.9%, a minimum of almost three years. The growth of the Eurozone economy has been weakening since the beginning of 2018, which forces the ECB to actively support the European economy, lowering the interest rate and expanding quantitative easing.
    Slowing European economies and soft ECB policies further weaken the euro.
    In general, the long-term negative dynamics of EUR / USD remains, which speaks in favor of sales of this currency pair.
    The breakdown of the short-term support level of 1.1094 will be a signal for building up short positions.
    Support Levels: 1.1094, 1.1047, 1.1015, 1.1000, 1.0970, 1.0900, 1.0850
    Resistance Levels: 1.1150, 1.1200

    Trading Recommendations

    Sell by market. Sell Limit 1.1150. Sell Stop 1.1090. Stop-Loss 1.1220. Take-Profit 1.1047, 1.1015, 1.1000, 1.0970, 1.0900, 1.0850
    Buy Stop 1.1220. Stop-Loss 1.1090. Take-Profit 1.1285, 1.1400


    *) For up-to-date and detailed analytics and news on the forex market visit Tifia Forex Broker website tifia.com

  4. #574
    Senior Member TifiaFX's Avatar
    Join Date
    Mar 2017
    Posts
    697
    WTI: despite the price increase, negative dynamics prevail
    10/24/2019

    In the middle of last month, the price of WTI crude oil rose sharply, approaching a strong resistance level of 63.50 (Fibonacci level 61.8% of the upward correction to the fall from the highs of the last few years near 76.80 to the support level near 42.15). The sharp rise in oil prices was facilitated by terrorist attacks on oil refineries in Saudi Arabia.
    However, the price could not break through this resistance level and subsequently fell, returning to the zone below the key level of 57.00 (ЕМА144, ЕМА200 on the daily and weekly charts).
    At the beginning of the European session, WTI crude oil is trading near 55.40 mark, through which the support level (Fibonacci 38.2%) passes, receiving support from yesterday's data on US oil reserves.
    Further growth and the breakdown of the resistance level of 57.00 will strengthen the bullish momentum and direct the price to the resistance level of 60.90 (July highs and the upper border of the descending channel on the daily chart) and further to the levels of 63.50, 64.40.
    In an alternative scenario, the signal for the resumption of sales will be a breakdown of the support level of 54.70 (ЕМА200 on the 4-hour chart).
    So far, a negative impulse prevails. Below the resistance level of 57.00, short positions remain preferred, while the current price increase should be considered corrective.
    Now, oil market participants will follow the publication on Friday (at 17:00 GMT) of the weekly report of the American oilfield services company Baker Hughes on the number of active drilling rigs in the United States. Previous reports indicated a decrease in the number of active oil platforms in the United States (to 713 units at the moment). If the report again indicates a decrease in the number of such installations, then this may give a short-term positive impetus to prices.
    Today, the attention of participants in financial markets will be focused at a meeting of the ECB. The decision on rates will be published at 11:45 (GMT), and the ECB press conference will begin at 12:30. Interest rates are likely to remain the same. However, the ECB's propensity to further soften its monetary policy may cause an increase in stock indices and quotes for commodities, including oil.
    Support Levels: 55.40, 54.70, 53.95, 53.00, 52.00, 51.30, 50.30, 49.00, 42.15
    Resistance Levels: 57.00, 59.50, 60.90, 63.50, 64.40, 66.50

    Trading Recommendations

    Sell Stop 54.60. Stop-Loss 56.10. Take-Profit 53.95, 53.00, 52.00, 51.30, 50.30, 49.00, 42.15
    Buy Stop 56.10. Stop-Loss 54.60. Take-Profit 57.00, 59.50, 60.90


    *) For up-to-date and detailed analytics and news on the forex market visit Tifia Forex Broker website tifia.com

  5. #575
    Senior Member TifiaFX's Avatar
    Join Date
    Mar 2017
    Posts
    697
    EUR/USD: Current Dynamics
    10/25/2019

    On Thursday, the EUR / USD pair fell after a meeting and a press conference of the ECB. This was also facilitated by some positive macro data from the United States. Preliminary PMI for the service sector in October reached a 3-month high of 51 against 50.9 in September. Preliminary PMI for the US manufacturing sector was 51.5 after 51.1 in September. The preliminary composite Purchasing Managers Index (PMI) for the United States rose to 51.2 in October from 51 in September. This was reported on Thursday by IHS Markit.
    EUR / USD hit a weekly low near 1.1093. However, on Friday the decline in the dollar and the growth of EUR / USD resumed.
    EUR / USD remains positive, trading on Friday above important short-term support levels of 1.1104 (ЕМА200 on the 1-hour chart), 1.1055 (ЕМА200 on the 4-hour chart).
    Nevertheless, a more significant growth of EUR / USD is limited by strong resistance levels of 1.1150 (ЕМА144 on the daily chart) and 1.1200 (ЕМА200 on the daily chart). The upper boundary of the descending channel on the weekly chart also passes through the 1.1200 mark.
    In general, the long-term negative dynamics of EUR / USD remains, which speaks in favor of sales of this currency pair.
    A signal for sales will be a breakdown of short-term support levels 1.1104, 1.1055.
    The publication of important news for today is not planned. Financial market participants continue to evaluate the results of yesterday's meeting of the ECB and align their positions before the Fed meeting. The next Fed meeting on monetary policy will be held next week, and the decision on the rate will be published on Wednesday, October 30 (at 18:00 GMT).
    However, you should pay attention to the publication (at 14:00 GMT) of the updated release of the University of Michigan Consumer Confidence Index for October. This indicator reflects the confidence of American consumers in the economic development of the country. A high level indicates economic growth, while a low indicates stagnation. The previous indicator value (for September) is 93.2, and the preliminary release indicated an increase in the indicator to 96.0. Deviations of the indicator in one direction or another from this value will also cause a short-term movement of the dollar in the same direction.
    Support Levels: 1.1104, 1.1055, 1.1000, 1.0940, 1.0900, 1.0850
    Resistance Levels: 1.1150, 1.1200

    Trading Recommendations

    Sell by market. Sell Limit 1.1150. Sell Stop 1.1090. Stop-Loss 1.1220. Take-Profit 1.1055, 1.1000, 1.0940, 1.0900, 1.0850
    Buy Stop 1.1220. Stop-Loss 1.1090. Take-Profit 1.1285, 1.1400


    *) For up-to-date and detailed analytics and news on the forex market visit Tifia Forex Broker website tifia.com

  6. #576
    Senior Member TifiaFX's Avatar
    Join Date
    Mar 2017
    Posts
    697
    S&P500: bullish trend remains valid
    10/28/2019

    After it became known about the progress in US-Chinese trade negotiations, growth in the US stock market accelerated.
    The Dow Jones Industrial Average up 0.6% on Friday to 26968.00 points.
    The S&P 500 on Friday increased by 0.4% to 3021.00 points, and by the end of the week gained 1.2%.
    According to the Ministry of Commerce of China, the trade representatives of the two countries "agreed to properly resolve key problems and confirmed that the technical consultations on some parts of the text of the agreement have basically been completed".
    The positive news that the parties are completing preparations for the first stage of the trade transaction also provoked an increase in the yield of US treasury bonds.
    US stock indexes remain positive ahead of the Fed meeting this week. The Fed is expected to cut rate by 0.25% to 1.75%.
    Nevertheless, if Fed leaders signal that they will take a break to evaluate the results of the mitigation cycle, this can cause a sharp increase in volatility in the financial markets and lead to profit taking in long positions in the US stock market.
    The market dynamics this week may also be affected by the meetings of the Bank of Japan and Bank of Canada, data from the US labor market and new corporate financial reports.
    On Monday (at 12:30 GMT) data on wholesale stocks in the US for September will be released. Economists expect stocks up 0.3% from the previous month after rising 0.2% in August. The increase in stocks in warehouses reflects a slowdown in the economy and negatively affects the US dollar and the dynamics of US stock indexes.
    If the data turn out to be better than the forecast, or lower than the previous value, this will provide additional support to the stock market and indices.
    The S & P500 index maintains long-term positive dynamics, trading above the key support level of 2895.0 (ЕМА200 on the daily chart). Long positions are preferred so far.
    In an alternative scenario and after the breakdown of support levels of 2997.0 (ЕМА200 on the 1-hour chart), 2972.0 (ЕМА200 on the 4-hour chart), S & P500 will go to support levels 2895.0, 2865.0 (Fibonacci level 23.6% of the correction to the growth from December 2018 and marks 2335.0).
    Further decline is unlikely. The long-term bullish trend of the US stock market remains.
    Support Levels: 2997.0, 2972.0, 2920.0, 2895.0, 2865.0
    Resistance Levels: 3029.0

    Trading Recommendations

    Sell Stop 2970.0. Stop-Loss 3030.0. Goals 2920.0, 2895.0, 2865.0
    Buy Stop 3030.0. Stop-Loss 2970.0. Goals 3100.0, 3200.0


    *) For up-to-date and detailed analytics and news on the forex market visit Tifia Forex Broker website tifia.com

  7. #577
    Senior Member TifiaFX's Avatar
    Join Date
    Mar 2017
    Posts
    697
    AUD/USD: Current dynamics and recommendations
    10/29/2019

    Positive news on the progress of US-Chinese trade negotiations supports the Australian currency. “China is likely to sign an agreement at an economic summit in Chile next month”, US President Donald Trump said Monday.
    The United States and China are Australia's largest trade and economic partners, and a positive shift in trade relations between the two countries has a positive effect on the mood of consumers and investors in the Australian economy.
    On Wednesday (at 00:30 GMT) inflation data in Australia in the 3rd quarter will be published. It is expected that the annual consumer price index will indicate an increase in inflation in the 3rd quarter by 1.7%, which is better than the CPI for the 2nd quarter (+1.6%).
    At the same time, betting on further significant growth of the Australian dollar and the pair AUD / USD is not necessary.
    Speaking at Canberra on Tuesday, the Reserve Bank of Australia manager Philip Lowe said further interest rates are likely to drop.
    "If we decide to ignore these trends (the actions of the central banks of other countries), the exchange rate is likely to rise. In the current environment, this will not be useful for employment growth and achieving the inflation target", Lowe said.
    At the same time, higher growth rates in the US economy than in other developed countries will contribute to increased demand for US assets and the US dollar.
    AUD / USD remains in a long-term downtrend, trading below the key resistance level of 0.6940 (EMA200 on the daily chart).
    The breakdown of the short-term support level of 0.6830 (EMA200 on the 1-hour chart) will be the first signal to resume sales of AUD / USD.
    In this case, the targets will be the support levels 0.6680, 0.6600. The immediate goal is located at support levels 0.6810 (ЕМА50 on the daily chart), 0.6802 (ЕМА200 on the 4-hour chart).
    In an alternative scenario, the correctional growth of AUD / USD will be limited by the resistance levels of 0.6890, 0.6940.
    Support Levels: 0.6830, 0.6810, 0.6802, 0.6745, 0.6700, 0.6680, 0.6600, 0.6300
    Resistance Levels: 0.6890, 0.6940

    Trading Recommendations

    Sell Stop 0.6825. Stop-Loss 0.6865. Take-Profit 0.6810, 0.6802, 0.6745, 0.6700, 0.6680, 0.6600, 0.6300
    Buy Stop 0.6865. Stop-Loss 0.6825. Take-Profit 0.6890, 0.6940


    *) For up-to-date and detailed analytics and news on the forex market visit Tifia Forex Broker website tifia.com

  8. #578
    Senior Member TifiaFX's Avatar
    Join Date
    Mar 2017
    Posts
    697
    USD/CAD: Fed and Bank of Canada rate decisions
    10/30/2019

    Futures on the DXY dollar index is trading at the beginning of today's European session near 97.42, 18 pips below the opening price of the current trading week and 188 pips below 99.30, near which it was trading earlier this month, when the DXY reached its highest level since March 2017 year.
    And yet, despite the decline, the long-term positive dynamics of the US dollar remains. The US economy growth rates, despite signs of a slowdown, is still higher than in other developed countries. The US continues to outperform other developed economies in terms of GDP growth, which creates the preconditions for maintaining demand for US assets and the dollar.
    Today (at 12:30 GMT) will be published annual data on US GDP. According to the forecast, GDP in the 3rd quarter grew by 1.7% after rising by 2.0% in the previous 2nd quarter.
    And at 18:00 (GMT), the Fed will publish its decision on interest rates. It is widely expected that the Fed will lower its base rate by 0.25% to 1.75%. However, market participants do not have full clarity regarding further plans of the Fed.
    Therefore, the attention of financial market participants will be focused on the Fed press conference, which will begin at 18:30 (GMT). If Fed leaders signal that they are likely to take a break in a further rate cut in order to evaluate the results of the ongoing mitigation cycle, this could trigger a fix for short positions and a dollar growth.
    If the rhetoric of the accompanying statement by the Fed is soft, then the growth of stock indices and the decline in the dollar may continue.
    At 14:00, the Bank of Canada will publish its decision on the rate. Bank of Canada officials said last month that the economy and labor market are in good shape despite escalating trade conflicts. This creates the prerequisites for the Bank of Canada to be able to leave its key rate unchanged at the current meeting, at the same level of 1.75%.
    Despite the decline, the long-term positive dynamics of the USD / CAD pair remains. The pair is trading above the key and long-term support level of 1.2900 (EMA200 on the weekly chart).
    A break into the zone above the resistance level 1.3230 (ЕМА144, ЕМА200 on the daily chart) will resume the bullish trend of USD / CAD and direct the pair towards recent local maxima near the resistance level 1.3345.
    The first signal to resume purchases will be the breakdown of resistance levels 1.3100 (ЕМА200 on the 1-hour chart), 1.3138 (September lows).
    Support Levels: 1.3050, 1.3015, 1.2900
    Resistance Levels: 1.3100, 1.3138, 1.3185, 1.3230, 1.3300, 1.3345, 1.3380

    Trading Scenarios

    Sell Stop 1.3040. Stop-Loss 1.3110. Take-Profit 1.3015, 1.2900
    Buy Stop 1.3110. Stop-Loss 1.3040. Take-Profit 1.3138, 1.3185, 1.3230, 1.3300, 1.3345, 1.3380, 1.3435, 1.3452, 1.3465, 1.3520


    *) For up-to-date and detailed analytics and news on the forex market visit Tifia Forex Broker website tifia.com

  9. #579
    Senior Member TifiaFX's Avatar
    Join Date
    Mar 2017
    Posts
    697
    EUR/USD: Fed lowered rate for the 3rd time this year
    10/31/2019

    The dollar continued to decline during today's Asian session. At the beginning of the European session on Thursday, the DXY dollar index futures were trading near 97.04, 20 pips below the opening price of today's trading day and 56 pips below the opening price of the current week.
    The Fed expectedly lowered the rate by 0.25% to 1.75% last Wednesday. At the same time, Fed leaders signaled that there was likely to be no further rate cut before the end of this year. At the same time, Fed Chairman Jerome Powell at a subsequent press conference again recognized the state of the US economy as strong, despite partial weakness in some sectors.
    “There are many risks left, but I have to say that the risks seem to have weakened”, Powell said.
    Now market participants will follow the publication on Thursday (at 12:30 GMT) of data on consumer and personal expenses and reports on employment and business activity in the manufacturing sector on Friday (at 12:30 and 14:00 GMT).
    The American economy, despite the difficulties, looks more stable in comparison with other major world economies, which will lead to continued demand for US stock market assets and the dollar.
    The political situation in the EU itself is quite tense, Britain’s exit from the EU is still surrounded by uncertainty, and the likelihood that the United States and China will not be able to consolidate their trade truce is still high.
    One way or another, EUR / USD is trading at the beginning of today's European session near the mark
    1.1170, 18 pips above today's open price. Despite the corrective growth, the long-term negative dynamics of this currency pair remains.
    In the case of the resumption of negative macroeconomic information, indicating a slowdown in the European economy, Eurodollar will resume decline.
    On a positive impulse received from the Fed meeting, EUR / USD broke through a strong resistance level of 1.1145 (EMA144 on the daily chart) and continued to grow during today's Asian session, reaching 2-month highs near 1.1175.
    Nevertheless, growth above the level of 1.1195 (EMA200 on the daily chart) is unlikely.
    Return to the area below the level of 1.1145 will cause the resumption of the downward trend.
    Support Levels: 1.1145, 1.1110, 1.1070, 1.1000, 1.0940, 1.0900, 1.0850
    Resistance Levels: 1.1195, 1.1240, 1.1285

    Trading Recommendations

    Sell by market. Sell Limit 1.1190, 1.1200. Sell Stop 1.1140. Stop-Loss 1.1220. Take-Profit 1.1110, 1.1070, 1.1000, 1.0940, 1.0900, 1.0850


    *) For up-to-date and detailed analytics and news on the forex market visit Tifia Forex Broker website tifia.com

  10. #580
    Senior Member TifiaFX's Avatar
    Join Date
    Mar 2017
    Posts
    697
    XAU/USD: Trading Scenarios
    11/01/2019

    The dollar is falling again, and gold is rising in price after the Fed meeting this week. As you know, the Fed again lowered the rate, for the third time this year, to the level of 1.75%, although it did not give clear signals aimed at further easing monetary policy.
    Market participants were also encouraged by the expectations of an early conclusion of a trade agreement between the United States and China. At the same time, investors fear that it may take longer than expected to conclude a trade agreement between the two countries that have the largest economies in the world, and disappointing macro data continues to come from various parts of the world with the world's largest economies.
    Today, market participants will focus on publishing data from the US labor market at 12:30 (GMT). US jobs are expected to grow by 89,000 in October, after rising 136,000 in September and 130,000 in August. If the US Department of Labor reports a significant increase in the number of jobs in October, observer concern about the possible impact of a slowdown in global economy for the US could weaken. However, if the report on the labor market coincides with the forecast or is worse than it, then this will further strengthen investors' doubts about the stability of the American economy in the context of international trade conflicts.
    This will be another reason for avoiding risks and buying protective assets, including gold.
    At the beginning of the European session on Friday, XAU / USD is trading above the important short-term support level of 1498.00 (EMA200 on the 4-hour chart and on the 1-hour chart) and above the support level at 1485.00 (Fibonacci level 50% of the correction to the wave of decline from September 2011 and mark 1920.00).
    The XAU / USD maintains long-term positive dynamics, and the fundamental background creates the prerequisites for maintaining demand for gold and further growth of XAU / USD towards long-term and absolute highs near the level of 1920.00 dollars per ounce.
    In an alternative scenario, the signal for sales will be a breakdown of the support levels of 1498.00 (EMA200 on the 4-hour chart and on the 1-hour chart), 1485.00 (Fibonacci level of 50% of the correction to the decline wave from September 2011 and the mark of 1920.00).
    In this case, a decline of the XAU / USD to support levels of 1408.00 (EMA200 on the daily chart), 1380.00 (Fibonacci level of 38.2% and highs of 2016), 1368.00 (highs of 2018) is possible.
    Nevertheless, a positive impulse and a tendency to further growth of XAU / USD prevail so far. Above the support levels of 1498.00, 1485.00, long positions are preferred.
    It is also worth recalling again that today at 12:30 (GMT) a sharp increase in volatility is expected, especially if the data on the US labor market will significantly differ from the forecast values. Probably the most cautious investors will prefer to stay out of the market during this period of time.
    Support levels: 1498.00, 1485.00, 1474.00, 1452.00, 1440.00, 1408.00, 1380.00, 1368.00, 1310.00, 1253.00
    Resistance Levels: 1520.00, 1535.00, 1555.00, 1585.00

    Trading Recommendations

    Sell Stop 1473.00. Stop-Loss 1522.00. Take-Profit 1452.00, 1440.00, 1408.00, 1380.00, 1368.00, 1310.00, 1253.00
    Buy Stop 1522.00. Stop-Loss 1473.00. Take-Profit 1535.00, 1555.00, 1585.00, 1600.00


    *) For up-to-date and detailed analytics and news on the forex market visit Tifia Forex Broker website tifia.com

Page 58 of 70 FirstFirst ... 8 48 56 57 58 59 60 68 ... LastLast

Tags for this Thread

Bookmarks

Posting Permissions

  • You may not post new threads
  • You may not post replies
  • You may not post attachments
  • You may not edit your posts
  •