
 1Likes
 LinkBack URL
 About LinkBacks


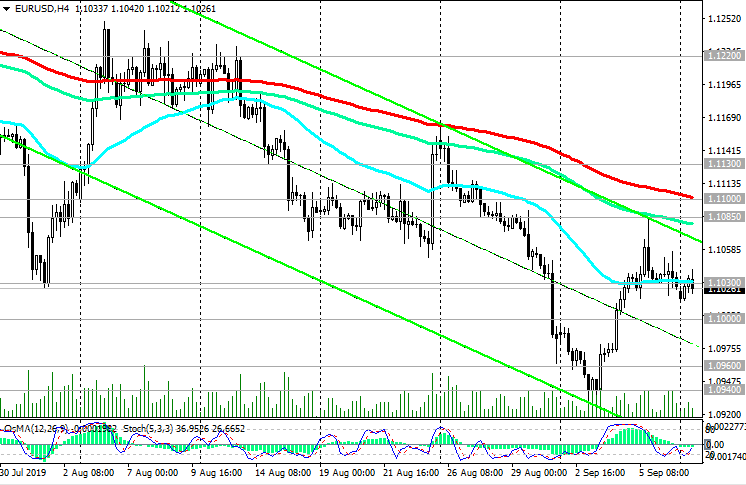
EUR/USD: Current dynamics on 09/09/2019
Published last Friday, data on the number of jobs outside the US agriculture in August fell short of expectations. According to data released on Friday by the Department of Labor, the number of jobs outside the US agriculture in August rose by 130,000 (the forecast was +150,000). The dollar is falling at the start of a new week after the publication of NFP.
Now investors are waiting for the Fed meeting next week and take into account the 100% probability of lowering rates by 0.25%.
Expectations of a more aggressive easing of the Fed's monetary policy are holding back investors from buying the dollar.
On Thursday (at 11:45 GMT), the ECB's decision on rates will be published. The ECB is expected to announce a large-scale easing program, as well as emphasizing its commitment to maintaining low interest rates.
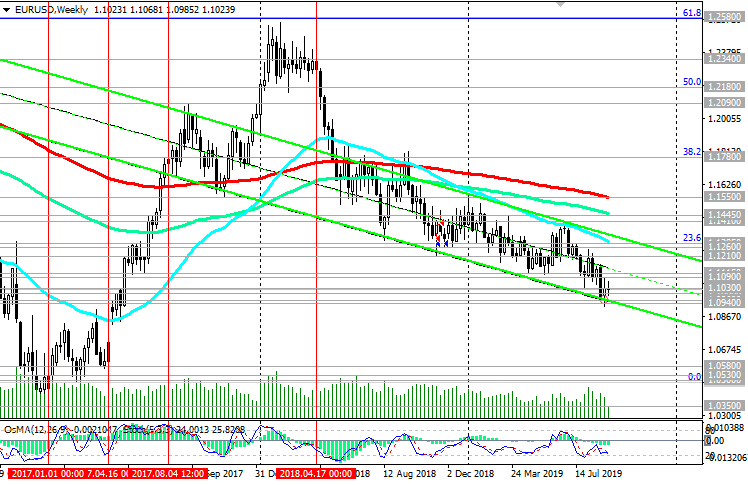
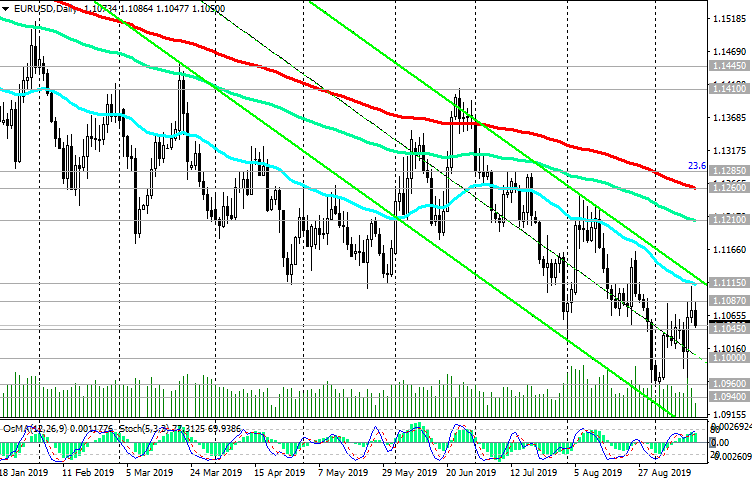
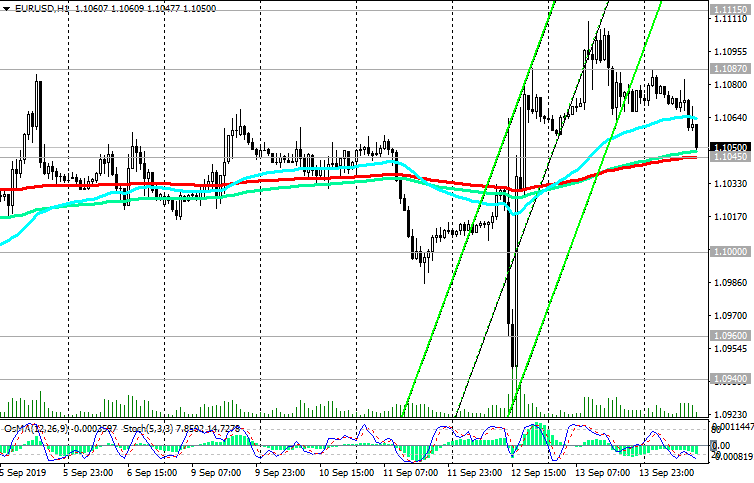
Thus, most likely, before the publication of the ECB's decision on rates, the EUR / USD pair will trade in the range near current levels and the level of 1.1030, but with a tendency to further decline.
The immediate objectives of the decline in the event of a breakdown of the local support level of 1.1000 will be otmeki 1.0960, 1.0940. In an alternative scenario, a breakdown of the short-term resistance level of 1.1100 (EMA200 on the 4-hour chart) may become a signal to start an upward correction. The target is located at the resistance level of 1.1130 (local maximums and ЕМА50 on the daily chart). Growth above these levels is unlikely. Long-term negative dynamics prevail. Expectations of further easing of the monetary policy of the ECB put pressure on the euro and the pair EUR / USD.
Support Levels: 1.1030, 1.1000
Resistance Levels: 1.1100, 1.1130, 1.1200, 1.1220, 1.1270, 1.1285
Trading Recommendations
Sell Stop 1.0990. Stop-Loss 1.1090. Take-Profit 1.0960, 1.0940, 1.0900
Buy Stop 1.1090. Stop-Loss 1.0990. Take-Profit 1.1100, 1.1130, 1.1200, 1.1220, 1.1270, 1.1285

*) For up-to-date and detailed analytics and news on the forex market visit Tifia Forex Broker website tifia.com


 Reply With Quote


Bookmarks