Page 52 of 70 FirstFirst ... 2 42 50 51 52 53 54 62 ... LastLast
Results 511 to 520 of 698
Like Tree1Likes

Tifia Daily Market Analytics

This is a discussion on Tifia Daily Market Analytics within the Analytics and News forums, part of the Trading Forum category; S&P500: Current dynamics before the Fed meeting 07/29/2019 Expectations of easing of the monetary policy of the Fed and positive ...


  1. #511
    Senior Member TifiaFX's Avatar
    Join Date
    Mar 2017
    Posts
    697
    S&P500: Current dynamics before the Fed meeting
    07/29/2019

    Expectations of easing of the monetary policy of the Fed and positive macro statistics coming from the United States are pushing major US stock indexes to new heights.
    Last week, the S&P500 index updated its record high near the 3028.0 mark after the US Department of Commerce released a report, according to which GDP grew in the 2nd by +2.1% (annualized) after +3.1% in the 1st quarter, with a forecast of +2.0%. At the same time, consumer spending, which accounts for more than two-thirds of the US economy, in the 2nd quarter grew at the highest rate since the end of 2017, reaching +4.3%.
    Trump again lashed out at the Fed after the publication of GDP data, calling the US central bank "a burden hanging on our neck", although GDP growth, in his opinion, was "not bad, given" the Fed's policy.
    At the same time, the GDP report did not affect expectations that the Federal Reserve will lower its key interest rate by 0.25 percentage points at the meeting July 30 - 31, given the continuing risks of a downturn in the global economy and the need to achieve the target inflation rate.
    Interest for investors will be the accompanying statements by the Fed leadership and a press conference following a meeting of the central bank. If Jerome Powell signals a propensity to lower the rate in September or before the end of the year, in this case, US stock indexes will accelerate their growth.
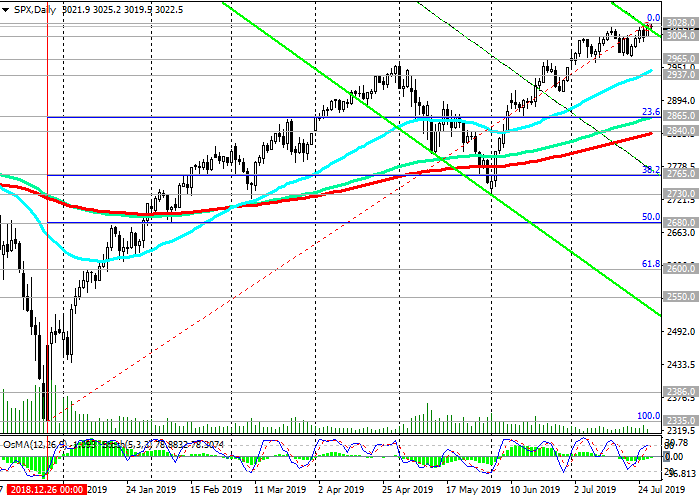
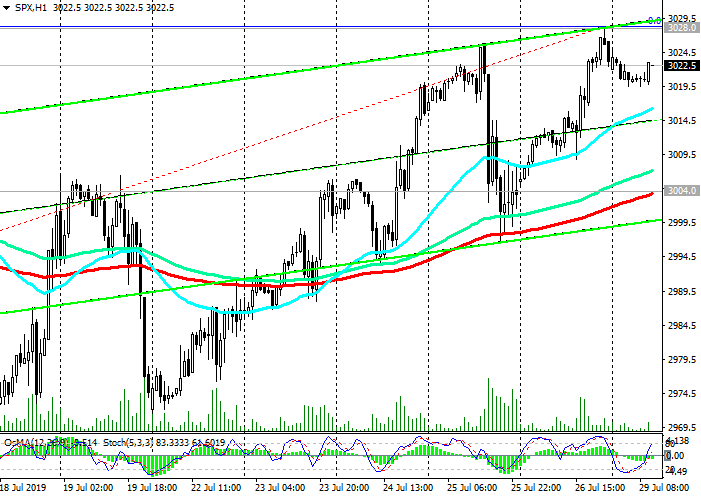
    Since the opening of today's trading day, the S&P500 is trading in a narrow range near the 3020.0 mark.
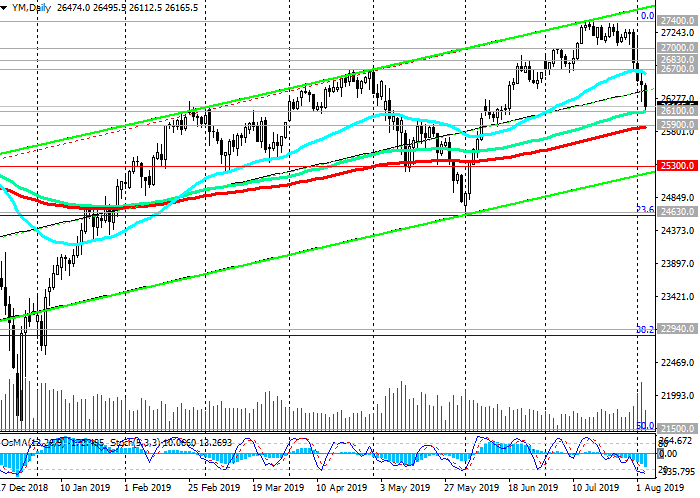
    Above support levels 2840.0 (ЕМА200 on the daily chart), 2865.0 (Fibonacci level 23.6% of the correction to the growth since December 2018 and 2335.0 mark), the bullish trend of the S&P500 remains.
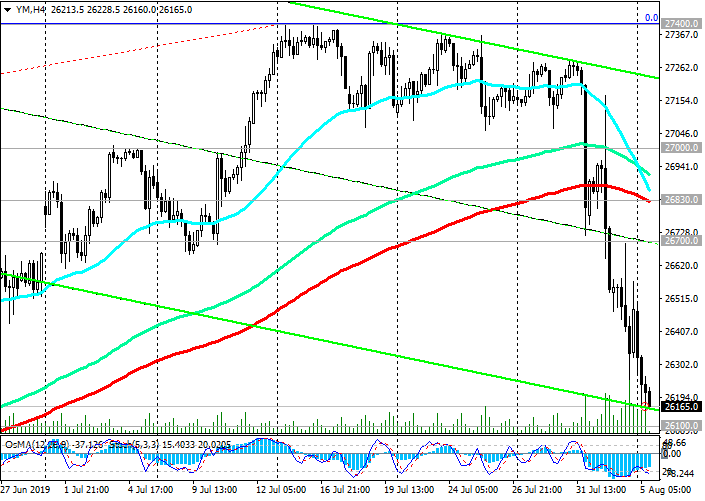
    The signal for sales and the start of a downward correction will be the breakdown of the short-term support level of 3004.0 (ЕМА200 on the 1-hour chart) with targets at the support levels of 2965.0 (ЕМА200 on the 4-hour chart and highs of May), 2937.0 (2018 highs).
    So far, long positions are preferred. However, it is also likely that the S&P500 will remain in the current range until the end of the Wednesday when the Fed’s decision and plans are known.
    Support Levels: 3004.0, 2965.0, 2937.0, 2865.0, 2840.0, 2765.0
    Resistance Levels: 3028.0

    Trading Recommendations

    Sell Stop 2990.0. Stop-Loss 3030.0. Targets 2965.0, 2937.0
    Buy Stop 3030.0. Stop Loss 2990.0. Targets 3050.0, 3100.0, 3200.0


    *) For up-to-date and detailed analytics and news on the forex market visit Tifia Forex Broker website tifia.com

  2. #512
    Senior Member TifiaFX's Avatar
    Join Date
    Mar 2017
    Posts
    697
    GBP/USD: the fall of the pound has intensified
    30/07/2019

    The pair GBP / USD resumed falling amid risks for the British economy due to the increased likelihood of a “tough” Brexit.
    Boris Johnson, who succeeded Theresa May as prime minister, said earlier that he was ready for a tough Brexit. On October 31, the UK should finally withdraw from the EU, even if no agreement is reached between the parties.
    "The exit agreement is dead and should be canceled, but there is a possibility of a new deal", Johnson said on Monday during his visit to Scotland. His press secretary announced the Prime Minister’s decision to refuse to meet with EU leaders, unless they change their position. "The UK will withdraw from the EU on October 31, anyway", she said.
    The pound fell 1.3% against the US dollar on Monday and also traded at the lowest level against the euro since September 2017. On Tuesday, the decline in the pound continues.
    In the current situation, only short positions should be considered for the GBP / USD pair. Mostly long-term negative dynamics. The immediate goal of the decline is the support level of 1.2000 (2017 lows and the Fibonacci 0% level of the correction to the decline of the GBP / USD pair in the wave that started in July 2014 near the level of 1.7200).
    Consideration of long positions can only be returned after the pair grows to a zone above resistance levels of 1.2480 (November 2018 lows), 1.2530 (ЕМА200 on 4-hour chart) with targets at resistance levels of 1.2775, 1.2840 (upper line of the ascending channel and ЕМА200 on the daily chart). However, this is an unlikely scenario.
    On Thursday at 11:00 (GMT) the decision of the Bank of England on the rate will be published, and at 11:30 the speech of the head of the Bank of England Mark Carney will begin. The risks of a “tough” Brexit and the likelihood of a deteriorating economic situation in the country have a negative impact on the Bank of England, which is aimed at easing policies. Although, most likely, the bank will refrain so far from any changes.
    Support Levels: 1.2110, 1.2000
    Resistance Levels: 1.2400, 1.2480, 1.2530, 1.2670, 1.2700, 1.2775, 1.2840

    Trading Recommendations

    Sell in the market. Stop Loss 1.2230. Take-Profit 1.2110, 1.2000
    Buy Stop 1.2230. Stop Loss 1.2150. Take-Profit 1.2400, 1.2480, 1.2530, 1.2670, 1.2700


    *) For up-to-date and detailed analytics and news on the forex market visit Tifia Forex Broker website tifia.com

  3. #513
    Senior Member TifiaFX's Avatar
    Join Date
    Mar 2017
    Posts
    697
    NZD/USD: the dynamics of the pair depends mainly on the Fed and the US dollar
    07/31/2019

    In mid-July, the NZD / USD pair broke through the key resistance level of 0.6710 (ЕМА200 on the daily chart) and continued to rise against the background of the weakening US dollar. Growth stopped at 0.6790, almost a 4-month high.
    The upper line of the ascending channel on the daily chart also passes through this mark. There was a rebound from it into the channel and to its lower boundary, passing near the level of 0.6610, where NZD / USD is now trading.
    Investors are waiting for the outcome of the two-day Fed meeting, which will end on Wednesday with the publication (at 18:00 GMT) of an interest rate decision. Probably, the Fed will reduce the interest rate by 25 basis points (to 2.25%). However, the markets have already taken into account in the quotations the reduction of the rate by 0.25%, and if the Fed does not give a strong signal about the further easing of its monetary policy, the dollar decline may have a short-term character.
    Steadily weak inflation is the main and, perhaps, so far the only negative domestic economic factor that can affect the Fed’s decision to lower the rate more strongly. Among other negative factors are the uncertainty in US trade relations with China and the risks of a slowdown in the global economy.
    At 18:30 (GMT), a press conference on the results of the Fed meeting will begin. Signals from Fed Chairman Jerome Powell, aimed at the likelihood of further easing of monetary policy, will cause the dollar to fall. Otherwise, after a short-term decline, the dollar is likely to resume growth, and the NZD / USD pair will decline.
    In this case, the decline in NZD / USD is likely to resume after a small short-term correction.
    After the breakdown of the local support level of 0.6585, NZD / USD will head towards the annual minimum near the 0.6490 mark. More distant targets of decline are located at support levels of 0.6430 (2018 lows), 0.6260 (Fibonacci 0% level and minima of the global decline pair from 0.8820).
    The signal for the resumption of long positions will be the breakdown of the short-term resistance level of 0.6659 (ЕМА200 on the 1-hour and 4-hour charts) with targets at the resistance levels of 0.6680 (ЕМА144), 0.6710 (ЕМА200 and the middle of the rising channel on the daily chart). Further growth of NZD / USD is unlikely, and short positions are preferred below the local support level of 0.6610.
    Support Levels: 0.6610, 0.6585, 0.6560, 0.6490, 0.6430, 0.6400, 0.6300, 0.6260
    Resistance Levels: 0.6659, 0.6680, 0.6710, 0.6790, 0.6865, 0.6910

    Trading Recommendations

    Sell Stop 0.6580. Stop Loss 0.6635. Take-Profit 0.6560, 0.6490, 0.6430, 0.6400, 0.6300, 0.6260
    Buy Stop 0.6635. Stop Loss 0.6580. Take-Profit 0.6659, 0.6680, 0.6710


    *) For up-to-date and detailed analytics and news on the forex market visit Tifia Forex Broker website tifia.com

  4. #514
    Senior Member TifiaFX's Avatar
    Join Date
    Mar 2017
    Posts
    697
    EUR/USD: Eurodollar is likely to continue to decline
    08/01/2019

    The dollar rose sharply, and the Eurodollar fell last Wednesday after the Fed’s decision regarding monetary policy became known. Fed cuts interest rate by 25 bp up to 2.25%. In general, such a decision was expected by market participants, although some of them counted on a 50 bp cut in interest rates.
    The Fed decided to lower the rate by 0.25% to protect the economy from the effects of the global slowdown and the escalation of trade tension. According to the Fed, "uncertainty about the prospects remains". At the same time, there was no clear signal from the Fed about a further rate cut, which caused disappointment among dollar sellers. At a subsequent press conference, Fed Chairman Jerome Powell also refrained from statements aimed at further easing the Fed's policies.
    According to the CME Group and according to the quotes of futures on Fed rates, market participants on Tuesday estimated at 87% the probability of another rate cut at the end of 2019, but now they believe that the probability of such a development is only 60%. As for the cycle of lowering rates, "at present we do not expect this", Powell said.
    The dollar went on the offensive, and the EUR / USD pair continued to decline during the Asian session on Thursday. At the beginning of the European session, the EUR / USD pair reached a new annual low near 1.1030 (the lower line of the downward channel on the weekly chart) amid expectations of further easing of the ECB's monetary policy.
    In the current situation, short positions in EUR / USD are preferable. Below the key resistance levels 1.1320 (ЕМА200 on the daily chart), 1.1285 (ЕМА144 on the daily chart and the Fibonacci level 23.6% of the correction to the fall from the level of 1.3900, which began in May 2014), long-term negative dynamics prevail.
    You can return to purchases only after the breakdown of the short-term resistance level of 1.1145 (ЕМА200 on the 1-hour chart), which will mean the beginning of an upward correction with a target near the resistance level 1.1210 (ЕМА50 on the daily chart and ЕМА200 on the 4-hour chart).
    There are no prerequisites for a more confident growth of EUR / USD. At the same time, long-term reduction targets are located near 2015 and 2017 lows and marks 1.0600, 1.0500. After the breakdown of the support level of 1.1030, the immediate goal will be the support level of 1.0900.
    Support Levels: 1.1030, 1.1000, 1.0900, 1.0500
    Resistance Levels: 1.1145, 1.1180, 1.1210, 1.1285, 1.1320

    Trading Recommendations

    Sell in the market. Stop-Loss 1.1080. Take-Profit 1.1000, 1.0900
    Buy Stop 1.1080. Stop-Loss 1.1020. Take-Profit 1.1145, 1.1180, 1.1210


    *) For up-to-date and detailed analytics and news on the forex market visit Tifia Forex Broker website tifia.com

  5. #515
    Senior Member TifiaFX's Avatar
    Join Date
    Mar 2017
    Posts
    697
    WTI: new Trump statements brought the oil market down
    08/02/2019

    On Thursday afternoon, global stock indices and oil prices collapsed after Trump announced on Twitter that he would introduce new duties on Chinese imports from next month. The unexpected and sharp aggravation of foreign trade tension was a shock for investors.
    The yield on 10-year US government bonds fell to 1.894%, the lowest level since November 8, 2016.
    After Trump's announcement of the introduction of new duties on Chinese goods, the DXY dollar index collapsed, and traders again raised rates on further easing the Fed's policies.
    The DXY Dollar Index Futures is trading Friday at the start of the European session near 98.00, 36 pips below its opening price on Thursday.
    Amid the aggravated trade conflict between the United States and China, the price of oil fell sharply (about 8%). This was the most significant fall since February 2015. Aggravation of the trade conflict increases uncertainty, which contributes to the fall of risky assets and commodity prices.
    On Friday, investors will focus on the July report on US employment, which will be published at 12:30 (GMT).
    The US labor market remains a strong fundamental factor supporting a positive assessment of the state of the US economy. Economists predict that the report will show an increase in the number of new jobs outside the US agriculture by 165,000 with an unemployment rate of 3.6% - 3.7%.
    This report is very important because (along with data on GDP and inflation indicators) it directly affects the Fed's decisions regarding interest rates.
    If the Fed in making decisions in the future will rely not only on the situation in the global financial market and on the aggravating world trade relations, but also on the incoming economic data, then with the deterioration of macroeconomic indicators, further mitigation of its monetary policy cannot be avoided.
    And this is a negative factor for the dollar, and a positive one - for commodity prices, including oil.
    Also, on Friday, oil market participants will follow the publication (at 17:00 GMT) of the weekly report of the American oilfield services company Baker Hughes on the number of active drilling rigs in the United States. Previous reports showed a decrease in the number of active oil platforms in the United States, to 776 units at the moment, from 784 units 2 weeks ago. If the report again indicates a decrease in the number of such installations, then this may give a short-term positive impetus to prices.
    However, at the moment, the oil market is subject to pressure from the intensification of international trade conflicts, primarily between the United States and China.
    Any strong news on this subject may again cause a surge in volatility in oil quotes.
    From a technical point of view, below the levels of 56.80 (EMA200 on the weekly chart), 58.50 (EMA200 on the daily chart) dollars per barrel of WTI crude oil, short positions are preferred.
    Support Levels: 54.10, 53.25, 50.30, 49.00, 42.15
    Resistance Levels: 55.40, 56.80, 58.00, 58.50, 59.50, 60.90, 63.50, 64.40, 66.50

    Trading Recommendations

    Sell Stop 53.90. Stop-Loss 55.60. Take-Profit 53.25, 50.30, 49.00, 42.15
    Buy Stop 55.60. Stop-Loss 53.90. Take-Profit 56.80, 58.00, 58.50, 59.50, 60.90, 63.50, 64.40, 66.50


    *) For up-to-date and detailed analytics and news on the forex market visit Tifia Forex Broker website tifia.com

  6. #516
    Senior Member TifiaFX's Avatar
    Join Date
    Mar 2017
    Posts
    697
    DJIA: Current Dynamics
    08/05/2019

    Against the background of expectations of easing the Fed's monetary policy, the US stock index DJIA updated last month the absolute and annual maximum near the level of 27400.0.
    Last week, the Fed lowered the rate by 0.25%. Many investors expected a rate cut by 0.50%, so the market reaction was restrained to this news.
    Although the indices have maintained their positive dynamics.
    However, stock indices, including the DJIA, crashed late last week after Trump tweeted that the United States introduced a new 10% duty on Chinese goods from September 1.
    Last week was the worst for US stock markets in a few months.
    S&P 500 on Friday fell by 0.7% to 2932.05 points. Dow Jones Industrial Average lost 0.4%, falling to 26485.01 points. Over the entire week, the S&P 500 fell 3.1% - this is its worst weekly dynamics since December. DJIA for the whole week fell by 2.6% and recorded the strongest weekly decline since May. The Nasdaq Composite fell 1.3% on Friday to 8004.07 points, and lost 3.9% over the entire week.
    On Monday, the fall of world and US stock indices continues.
    Hong Kong's Hang Seng index fell 2.9% to 26151.32 points on Monday in Japan, while the Japanese Nikkei Stock Average fell 1.7% to 20720.29 points on the back of the yen rising to a 7-month high.
    Futures on the S&P500 index are trading at the beginning of the European session on Monday near 2888.0, 40 pips (or 1.3%) below the opening price of today's trading day.
    Futures on the DJIA index are trading at the beginning of the European session near the mark of 26100.0, 370 points (or 1.4%) below the opening price of today's trading day, near the support level of 26100.0 (EMA144 on the daily chart).
    In case of breakdown of the support level 25900.0 (ЕМА200 on the daily chart), the following objectives will be the support level 25300.0 (the bottom line of the ascending channel on the daily and weekly charts) and the important support level 24630.0 (Fibonacci level 23.6% of the correction to the DJIA growth wave that began in February 2016 from the mark of 15500.0).
    Nevertheless, despite the current decline, there is the long-term positive dynamics of the American stock indices and the DJIA index, including.
    A return to the zone above the resistance levels of 26700.0 (ЕМА50 on the daily chart and maximums of April 2019), 26830.0 (ЕМА200 on the 4-hour chart) will indicate a restoration of the bull trend and the resumption of purchases.
    In the meantime, you should refrain from shopping.
    Support Levels: 26100.0, 25900.0, 25300.0, 24630.0
    Resistance Levels: 26700.0, 26830.0, 27000.0, 27400.0

    Trading Scenarios

    Buy Stop 26850.0. Stop-Loss 25980.0. Take-Profit 27000.0, 27400.0, 27500.0
    Sell Stop 25980.0. Stop-Loss 26850.0. Take-Profit 25900.0, 25300.0, 24630.0


    *) For up-to-date and detailed analytics and news on the forex market visit Tifia Forex Broker website tifia.com

  7. #517
    Senior Member TifiaFX's Avatar
    Join Date
    Mar 2017
    Posts
    697
    NZD/USD: amid escalation of international trade conflicts
    08/06/2019

    On Wednesday, the next meeting of the RBNZ will be held, devoted to issues of monetary policy. The publication of the decision on rates is scheduled for 02:00, and the press conference of the RBNZ following the meeting will begin at 03:00 (GMT). The RBNZ recently revised economic forecasts downward, and probably the bank will signal a further easing of monetary policy.
    Many economists are inclined to believe that the RBNZ can lower the interest rate at least twice before the end of the year.
    The slowdown in the global economy and the increase in import duties negatively impact the export-oriented New Zealand commodity economy.
    Last Thursday, US President Donald Trump announced his readiness to introduce an additional 10% duty on Chinese goods from September 1. Shortly afterwards, when the yuan / US dollar broke through level 7, the People’s Bank of China said its currency weakened under the influence of "protectionist measures and the expectation of the introduction of additional duties against China" from the United States.
    The erupting trade conflict between New Zealand's two largest trading partners - China and the United States, as well as the risks of a slowdown in the global economy puts pressure on the RB of New Zealand to further mitigate monetary policy.
    And this is a strong negative factor for NZD.
    Currently, NZD / USD is trading near 0.6545, having slightly adjusted against the backdrop of positive news from the New Zealand labor market, published at the beginning of the Asian session on Tuesday.
    The tendency of the RBNZ to further lower the rate will cause a further weakening of the NZD and a drop in the pair of NZD / USD.
    In this case, a breakdown of the local support level of 0.6490 (lows in May, June, August) will provoke a further decrease in NZD / USD with targets at support levels of 0.6430 (lows of 2018), 0.6260 (Fibonacci level of 0% and lows of the global pair decline wave from 0.8820) .
    Short positions are preferred so far.
    An alternative scenario assumes a breakdown of the local resistance level of 0.6588 with targets at resistance levels of 0.6670 (EMA144 and the middle of the rising channel on the daily chart), 0.6700 (EMA200 on the daily chart).
    Further growth of NZD / USD is unlikely, unless, of course, the Fed also begins to aggressively reduce interest rates amid ongoing events in the financial markets.
    From the news for today, we are waiting for the publication (in the period after 13:45 GMT) of data with the results of a milk auction organized by the New Zealand company Fonterra (a specialized trading platform GlobalDairyTrade - GDT). If the data indicate a fall in world prices for dairy products (forecast: -1.1%), primarily for milk powder, then the New Zealand dollar will decline.
    Support Levels: 0.6510, 0.6490, 0.6430, 0.6400, 0.6300, 0.6260
    Resistance Levels: 0.6588, 0.6635, 0.6670, 0.6700, 0.6790, 0.6865, 0.6940

    Trading Recommendations

    Sell by market. Stop-Loss 0.6590. Take-Profit 0.6510, 0.6490, 0.6430, 0.6400, 0.6300, 0.6260
    Buy Stop 0.6590. Stop-Loss 0.6540. Take-Profit 0.6635, 0.6670, 0.6700


    *) For up-to-date and detailed analytics and news on the forex market visit Tifia Forex Broker website tifia.com

  8. #518
    Senior Member TifiaFX's Avatar
    Join Date
    Mar 2017
    Posts
    697
    XAU/USD: the threat of recession is growing
    08/07/2019

    The sharp aggravation of the trade conflict between the United States and China led to increased fears of a recession in the United States and an even greater slowdown in global economic growth. This causes an increase in demand for defensive assets such as yen, government bonds, gold.
    The yield on government bonds continues to decline, indicating an increasingly pessimistic mood of investors regarding the prospects for the economy. Yields on 10-year US Treasury bonds fell on Wednesday to 1.660% from 1.864% on Friday, to the lowest level since October 2016.
    Gold quotes broke through the level of 1485.00 on Wednesday, reaching $ 1491.00 per troy ounce at the beginning of the European session. This is consistent with new highs since May 2013.
    Shortly after the threat from the United States to impose new duties, the Chinese leadership banned state-owned companies from purchasing agricultural products, including soybeans, from the United States, which is a serious blow to American farmers. New duties will also increase the price of all goods in the United States.
    If U.S. stock indices begin to decline again and close this week near the levels reached on Tuesday, then this will be the strongest weekly decline since December 2018.
    White House economic adviser Lawrence Kudlow told CNBC on Tuesday that the US still wants to strike a deal with China despite being recognized it as currency manipulator, and continues to prepare for the Chinese trade delegation to arrive in the US in September.
    However, many observers do not expect the United States or China to make any concessions. The trade conflict between the countries becomes unpredictable, which even more worries investors and increases the likelihood of a recession in the US and in the world.
    Many economists estimate the likelihood of a recession in the United States next year at 50%.
    In this situation, the demand from investors for protective assets and gold, including, is likely to continue in the near future.
    And as soon as the Fed announces further easing of monetary policy, the price of gold will go in the direction of multi-year and absolute highs near the mark of 1920.00 dollars per ounce.
    On Wednesday, XAU / USD hit a new 6-year high near 1491.00. The pair tested an important resistance level of 1485.00 (Fibonacci level 50% of the correction to the wave of decline since September 2011 and the mark of 1920.00). Fixation in the zone above this resistance level will indicate the completion of the correction and the full restoration of the global bullish gold trend.
    In case of further growth of the XAU / USD pair, the intermediate target is at the resistance level of 1585.00 (Fibonacci level of 61.8%).
    A strong positive momentum prevails. Above the local support levels of 1452.00 (July highs), 1440.00 (June highs), long positions are preferred.
    An alternative scenario involves the breakdown of these support levels and a decrease to support levels of 1380.00 (Fibonacci 38.2% and highs of 2016), 1366.00 (highs of 2018), 1346.00 (bottom line of the ascending channel on the weekly chart).
    But it’s too early to think about sales.
    Support Levels: 1452.00, 1440.00, 1413.00, 1380.00, 1366.00, 1346.00, 1325.00, 1315.00, 1284.00, 1268.00, 1253.00
    Resistance Levels: 1485.00, 1500.00, 1585.00

    Trading Recommendations

    Sell Stop 1470.00. Stop-Loss 1493.00. Take-Profit 1452.00, 1440.00, 1413.00
    Buy Stop 1493.00. Stop-Loss 1470.00. Take-Profit 1500.00, 1585.00


    *) For up-to-date and detailed analytics and news on the forex market visit Tifia Forex Broker website tifia.com

  9. #519
    Senior Member TifiaFX's Avatar
    Join Date
    Mar 2017
    Posts
    697
    AUD/USD: downward dynamics prevails
    08/08/2019
    Current Dynamics

    The escalation of the trade war between the United States and China has strengthened expectations of a worsening situation in world international trade and the economy. The growth of fears about this caused a collapse of stock quotes and indices on world stock markets. Demand for safe haven assets, such as government bonds, yen, gold, has risen sharply. On Wednesday, gold prices exceeded $ 1,500 an ounce for the first time in six years. Since the beginning of the month, prices have increased by 6.9%, and from the end of May - by 15%. Yields on 10-year US Treasury bonds fell on Wednesday to 1.595% from 1.864% on Friday, to the lowest level since October 2016.
    Last Wednesday, interest rates fell immediately by three central banks (India, New Zealand and Thailand). On Wednesday, the RBNZ lowered its official interest rate by 0.50% to 1.00%, which was the second rate cut this year.
    As follows from the text of the RBNZ statement, "global economic activity continues to weaken ... increased uncertainty and reduced international trade contribute to lower economic growth in the trading partner countries ... and central banks relax monetary policy to support their economies".
    The RBA last Tuesday left the key interest rate at a record low of 1%, but gave a pessimistic forecast for the economy. "It is reasonable to expect that a long period of low interest rates will be required to progress towards lowering unemployment and achieve steady progress towards the target inflation rate", Philip Lowe said on Tuesday.
    At 23:30 (GMT) on Thursday, Lowe will begin speaking with members of the parliamentary committee on economics. If he points out that the key rate needs to be lowered again, then the Australian dollar will again be under pressure. In this case, the pair AUD / USD will again go “south” as part of a global downtrend.
    At the beginning of the European session, the pair AUD / USD is trading near the level of 0.6787, correcting after falling on Wednesday.
    Nevertheless, negative dynamics prevail, despite the correction. It is likely that the current position of AUD / USD and growth to the levels of 0.6800, 0.6816, 0.6830 will be a good opportunity to resume sales of this currency pair.
    We can return to the consideration of long positions only after the growth of AUD / USD to the zone above the resistance level of 0.6910 (EMA200 on the 4-hour chart) with targets not higher than the key resistance level of 0.7065 (EMA200 on the daily chart).
    In case of resumption of decline, the targets will be the support levels 0.6680, 0.6600. The distant target is located at support levels of 0.6260, 0.6000 (lows of 2008-2009).
    Support Levels: 0.6745, 0.6700, 0.6680, 0.6600, 0.6300
    Resistance Levels: 0.6816, 0.6830, 0.6865, 0.6910, 0.7000, 0.7065

    Trading Recommendations

    Sell by market. Sell-Limit 0.6800, 0.6816, 0.6830. Stop-Loss 0.6870. Take-Profit 0.6745, 0.6700, 0.6680, 0.6600, 0.6300
    Buy Stop 0.6870. Stop-Loss 0.6810. Take-Profit 0.6910, 0.7000, 0.7065


    *) For up-to-date and detailed analytics and news on the forex market visit Tifia Forex Broker website tifia.com

  10. #520
    Senior Member TifiaFX's Avatar
    Join Date
    Mar 2017
    Posts
    697
    WTI: negative momentum prevails
    08/09/2019

    Global financial markets remain under pressure from intensified international trade conflicts, primarily between the United States and China. The oil market does not stand aside. Oil prices are actively declining, having lost about 25% over the past 12 months.
    Last Thursday, the price reached a new 7-month low near $ 50.47 per barrel of WTI crude oil after Donald Trump announced the introduction of new duties on the import of Chinese goods into the United States.
    The trade conflict between the United States and China reached a new level when Chinese authorities announced retaliation. In particular, Beijing banned Chinese state-owned companies from buying soybeans in the United States, and the People's Bank of China lowered the RMB to dollar exchange rate below 7.0000.
    The oil market received an additional negative impetus after last Wednesday the US Department of Energy’s Energy Information Administration reported an increase in oil reserves in the country last week (+2.385 million barrels, while oil reserves were expected to fall by 2.845 million barrels).
    The fall in oil prices indicates an increase in investor anxiety about the state of the global economy, which continues to negatively affect financial markets.
    The breakdown of the support level of 50.30 (Fibonacci level 23.6% of the upward correction to the fall from the highs of the last few years near the level of 76.80 to the level of support near the mark of 42.15) and a further decrease will mean the return of WTI oil prices to the global bearish trend.
    In this case, the preliminary reduction targets will be located at the support level of 42.15 (Fibonacci level of 0% and December 2018 lows).
    In an alternative scenario, the signal to resume purchases will be a breakdown of the short-term resistance level 54.40 (ЕМА200 on the 1-hour chart) and growth into the zone above the resistance level 55.40 (Fibonacci 38.2%) with targets at the resistance level 58.80 (ЕМА200 on the daily chart). Fixing the price in the zone above the resistance level of 59.50 (Fibonacci level of 50%) will speak about the resumption of the bull trend.
    On Friday, oil market participants will follow the publication (at 17:00 GMT) of the weekly report of the American oilfield services company Baker Hughes on the number of active drilling rigs in the United States. Previous reports indicated a decrease in the number of active oil platforms in the United States, to 770 units at the moment. If the report again indicates a decrease in the number of such installations, then this may give a short-term positive impetus to prices.
    However, a strong negative momentum prevails. Short positions are preferred.
    Support Levels: 50.30, 49.00, 42.15
    Resistance Levels: 54.40, 55.40, 56.80, 58.00, 59.50, 60.90, 63.50, 64.40, 66.50

    Trading Scenarios

    Sell Stop 51.85. Stop-Loss 53.75. Take-Profit 50.30, 49.00
    Buy Stop 53.75. Stop-Loss 51.85. Take-Profit 54.40, 55.40, 56.80, 58.00


    *) For up-to-date and detailed analytics and news on the forex market visit Tifia Forex Broker website tifia.com

Page 52 of 70 FirstFirst ... 2 42 50 51 52 53 54 62 ... LastLast

Tags for this Thread

Bookmarks

Posting Permissions

  • You may not post new threads
  • You may not post replies
  • You may not post attachments
  • You may not edit your posts
  •