
 1Likes
 LinkBack URL
 About LinkBacks


AUD/USD: Current Dynamics
05/17/2019
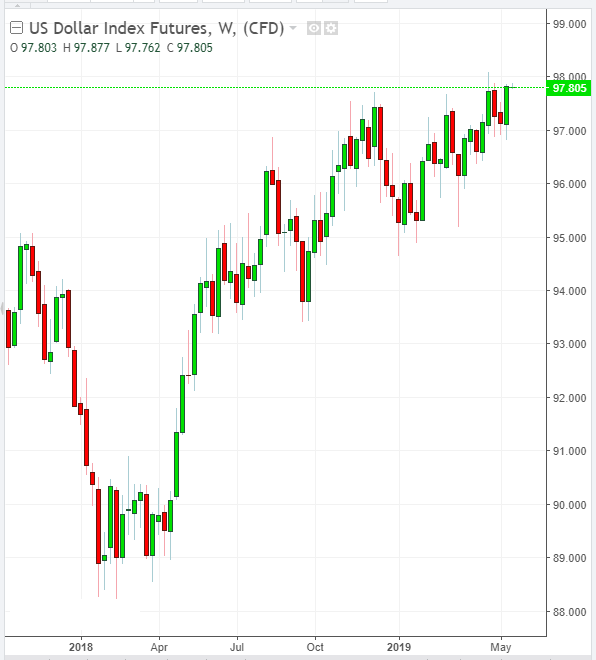
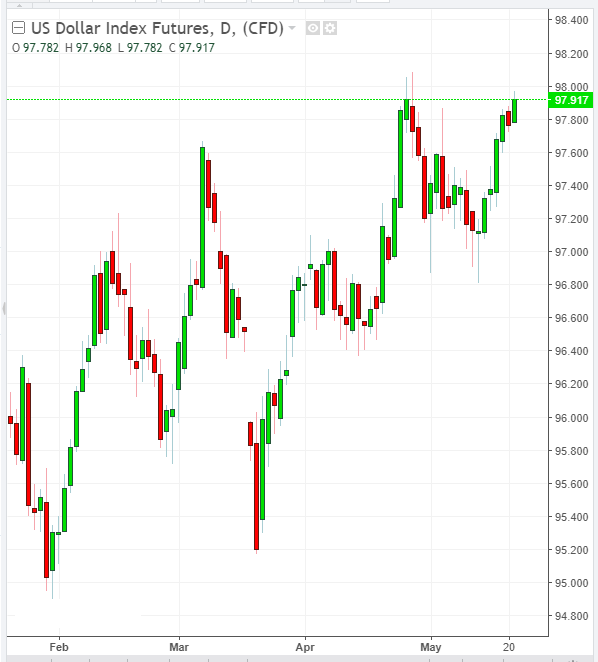
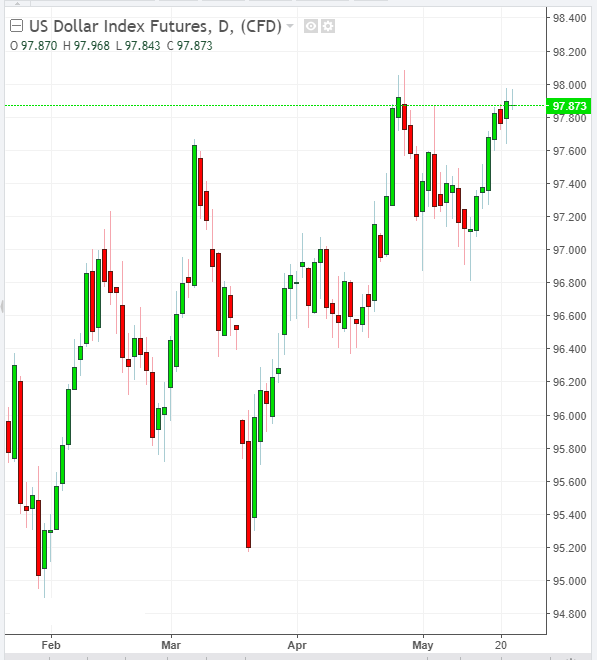
The US dollar rose on Thursday. The dollar index DXY, reflecting the value of the dollar against a basket of 6 major currencies, rose by 32 points on Thursday, to 97.68. Published US economic data exceeded expectations, which increased investor risk appetite.
According to data released on Thursday, the number of new homes in the United States has increased by 5.7% in April compared with the previous month and amounted to 1.235 million units; the number of initial claims for unemployment benefits was 212,000 (compared with the forecast of 220,000 and 228,000 in the previous weekly period).
On Friday, investors will pay attention to the publication (at 14:00 GMT) of the consumer confidence index from the University of Michigan. The index is an indicator of consumer confidence in economic growth. High result strengthens USD, low - weakens
The index is expected to rise to 97.5 in May against 97.2 in April. Probably, the US dollar will receive an additional impetus to growth, if the data is confirmed or will be better than the forecast. The data below the forecast will have a downward pressure on the dollar, but only in the short term.
Under conditions of uncertainty and escalation of international trade wars, the US dollar looks preferable to other currencies due to the greater stability of the American economy.
On Friday, the USD growth continues, while the DXY dollar index futures traded at the beginning of the European session near the 97.73 mark.
Meanwhile, the Australian dollar is falling after data came out on Thursday indicating that unemployment was rising in Australia to 5.2%. The revised data also indicated that unemployment in March was 5.1% versus a previous estimate of 5.0%.
Rising unemployment increases the pressure on the RBA to lower interest rates. On Tuesday, the RBA Governor will deliver a speech in Brisbane. It is possible that he will signal the imminent reduction in rates. Investors estimate the likelihood of the June decline in RBA rates at 40% and 100% in August.
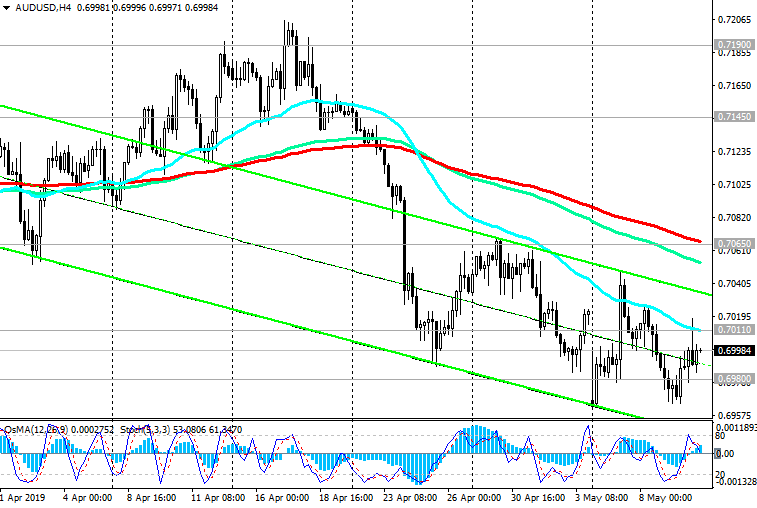
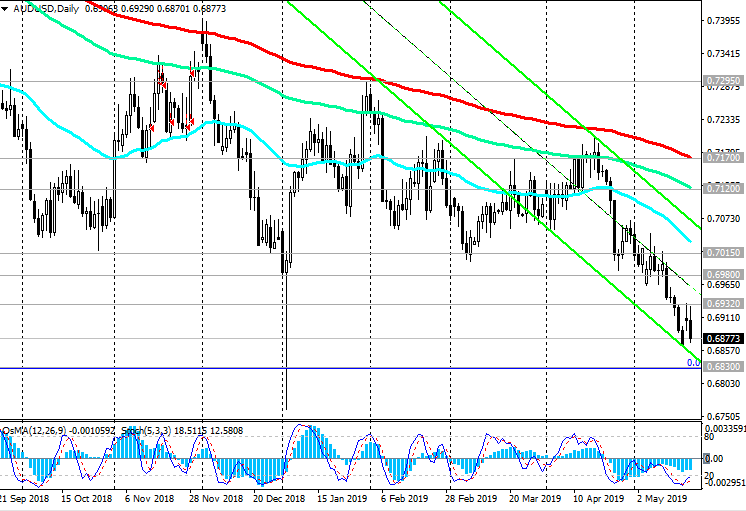
In the current situation, the most likely scenario is a further decrease in AUD / USD with the closest target at 0.6830 (2016 lows).
Below the key resistance levels of 0.7130 (EMA144 on the daily chart), 0.7170 (EMA200 on the daily chart) short positions remain preferable. A strong negative impulse prevails.
Support Levels: 0.6830, 0.6800
Resistance Levels: 0.6953, 0.6980, 0.7030, 0.7130, 0.7170
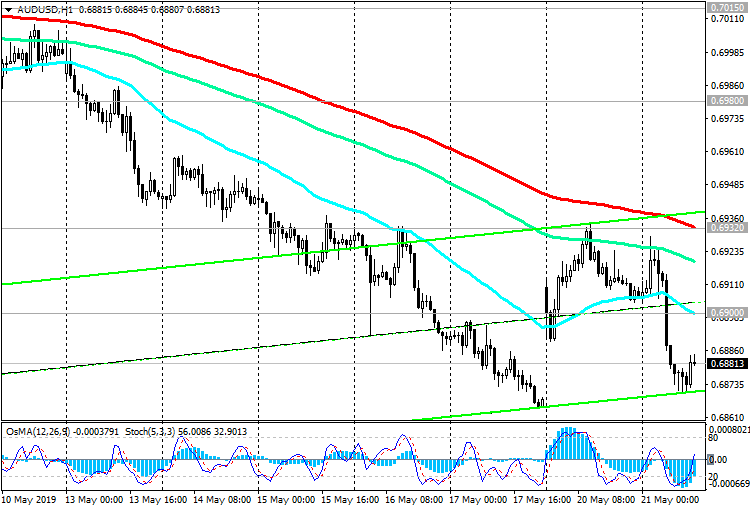
Trading recommendations
Sell in the market. Stop Loss 0.6910. Take-Profit 0.6830, 0.6800
Buy Stop 0.6910. Stop Loss 0.6870. Take-Profit 0.6953, 0.6980, 0.7030, 0.7130, 0.7170
[img]httpshttps://i.postimg.cc/RCY0wsbb/100519-DXY.png[/img]
*) For up-to-date and detailed analytics and news on the forex market visit Tifia Forex Broker website tifia.com


 Reply With Quote


Bookmarks