Page 122 of 128 FirstFirst ... 22 72 112 120 121 122 123 124 ... LastLast
Results 1,211 to 1,220 of 1272
Like Tree3Likes

Forex News Analysis by LiteForex

This is a discussion on Forex News Analysis by LiteForex within the Analytics and News forums, part of the Trading Forum category; EUR/USD: ambiguous trading Current trend EUR is showing ambiguous trading during today's Asian session, consolidating near 1.2100 after the instrument ...


  1. #1211
    Senior Member MikhailLF's Avatar
    Join Date
    Sep 2017
    Posts
    830
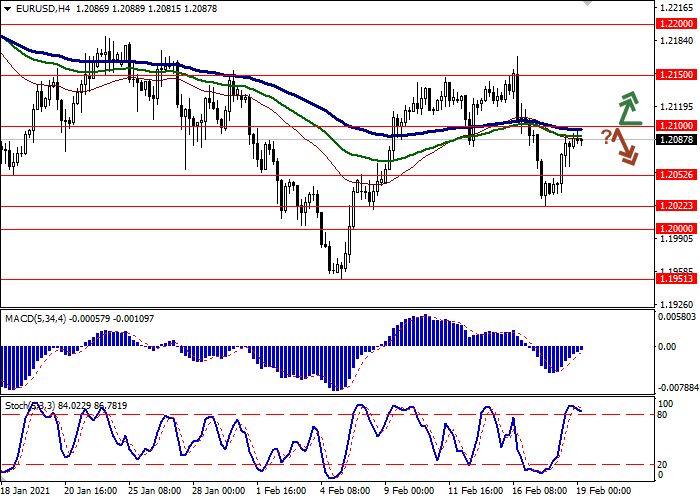
    EUR/USD: ambiguous trading

    Current trend

    EUR is showing ambiguous trading during today's Asian session, consolidating near 1.2100 after the instrument retraced the day before. The reason for yesterday's resumption of "bullish" trend was the disappointing data from the US. Initial Jobless Claims for the week ending February 12 again showed an increase from 848K to 861K, while analysts expected their reduction to 765K. Continuing Jobless Claims for the week ending February 5 fell from 4.558M to 4.494M, which fell short of the most optimistic forecasts of 4.413M. Thus, investors are again convinced that it is still somewhat premature to talk about the beginning of a confident recovery of the American economy. As Jerome Powell said, it will take years for the labor market to return to its previous levels.

    The focus of European investors today is statistics on business activity in the manufacturing and services sectors in Germany and the eurozone for February.

    Support and resistance

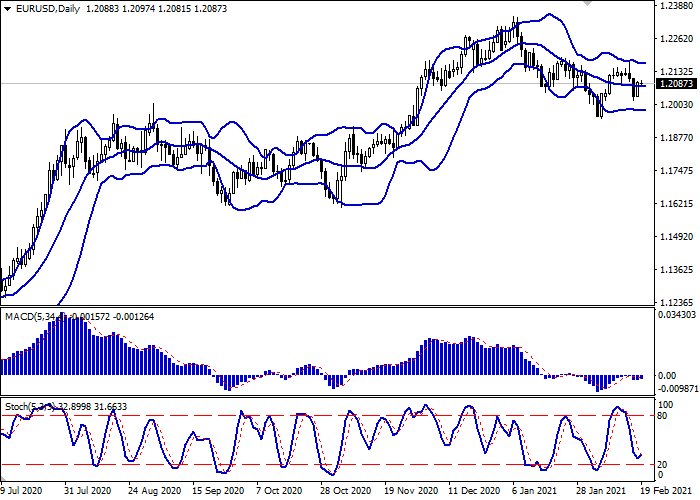
    Bollinger Bands in D1 chart demonstrate flat dynamics. The price range is changing slightly, but remains rather spacious for the current level of activity in the market. MACD has reversed towards growth without forming a buy signal (located below the signal line). Stochastic shows similar dynamics, reversing upwards near the level of "20". Current readings of the indicator signal in favor of a corrective growth in the ultra-short term.

    Resistance levels: 1.2100, 1.2150, 1.2200.
    Support levels: 1.2052, 1.2022, 1.2000, 1.1951.


  2. #1212
    Senior Member MikhailLF's Avatar
    Join Date
    Sep 2017
    Posts
    830
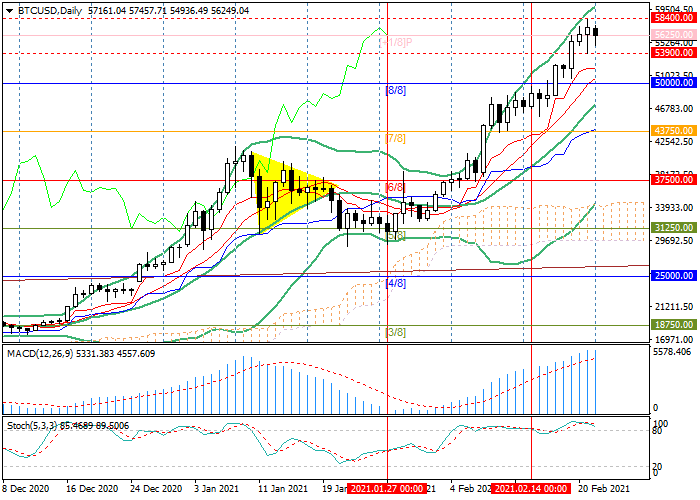
    BTC/USD: growth prospects remain

    Current trend

    Last week, the pair has continued growing. The price reached new all-time highs, rising above 58000.00 and adding about 17.4%.

    The growth in quotes was due to the growing popularity of BTC among large institutional players. Tesla Inc. investment into Bitcoin encouraged other large global companies to enter the digital assets market. German SynBiotic SE has officially announced the transfer of part of its liquidity to BTC, as it fears a serious devaluation of world fiat currencies.

    The price increase is supported by the launch in Canada of the first Bitcoin ETF in North America. Its shares began trading on the Toronto Stock Exchange on February 18. According to Bloomberg, in the first two days, the fund managed to attract investments in the amount of USD 421M, which is several times higher than the capitalization of the average Canadian ETF. Bitcoin ETF trading may be allowed in the US in the near term, providing new support for the entire cryptocurrency sector.

    Support and resistance

    The price maintains an uptrend, which is confirmed by upward reversal of the Bollinger Bands and an increase in the MACD histogram in the positive zone. Now the price is trying to consolidate above 56250.00 (Murrey [+1/8]). If successful, the growth of quotations will continue to 62500.00 (Murrey [+2/8]) and 65600.00 (Murrey [+5/8], H4). A downward reversal of Stochastic in the overbought zone does not exclude a price rollback to 50000.00 (Murrey [8/8]), but is unlikely to lead to the uptrend reversal.

    Resistance levels: 56250.00, 62500.00, 65600.00.
    Support levels: 53900.00, 50000.00, 43750.00.


  3. #1213
    Senior Member MikhailLF's Avatar
    Join Date
    Sep 2017
    Posts
    830
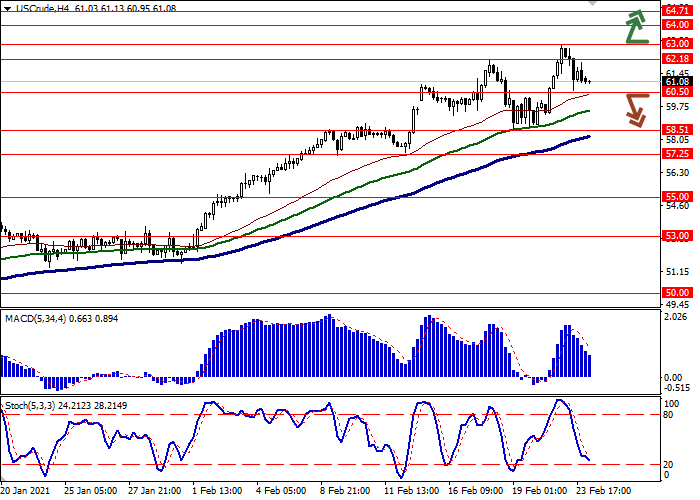
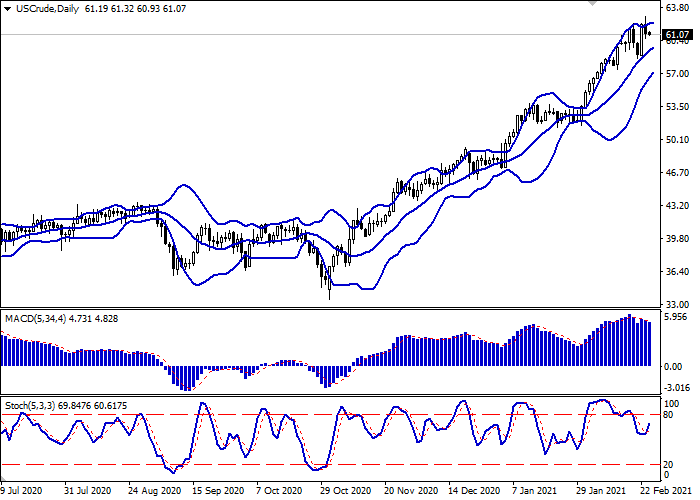
    WTI Crude Oil: oil prices are consolidating

    Current trend

    Yesterday oil prices hit record highs since January 2020. Today during the Asian session, the price moves flat, trading near $61 per barrel. It is supported by the optimistic market’s mood, expecting a further easing of quarantine restrictions and the restoration of oil demand to previous levels. However, the speech of the head of the US Fed Jerome Powell in Congress alarmed investors, as he noted that it would take "some time" for the economy to recover.

    Yesterday’s API report on oil reserves also contributed to the development of corrective dynamics. For the week of February 19, stocks in the country rose by 1.026 million barrels after falling by 5.8 million barrels in the previous period. On Wednesday, traders are focused on the second Powell’s speech and the publication of a report on oil reserves from the US Department of Energy.

    Support and resistance

    Bollinger bands grow steadily on the daily chart. The price range narrows from above, reflecting the ambiguous nature of trading at the beginning of the week. MACD falls, maintaining a poor sell signal (the histogram is below the signal line). Stochastic reversed upwards after the flat dynamics and indicates the remaining “bullish” potential after the active growth at the beginning of the week.

    To open new trading positions, it is better to wait until the signals from technical indicators are clarified.

    Resistance levels: 62.18, 63.00, 64.00, 64.71.
    Support levels: 60.50, 58.51, 57.25, 55.00.


  4. #1214
    Senior Member MikhailLF's Avatar
    Join Date
    Sep 2017
    Posts
    830
    USD/CAD: wave analysis

    The pair may fall.

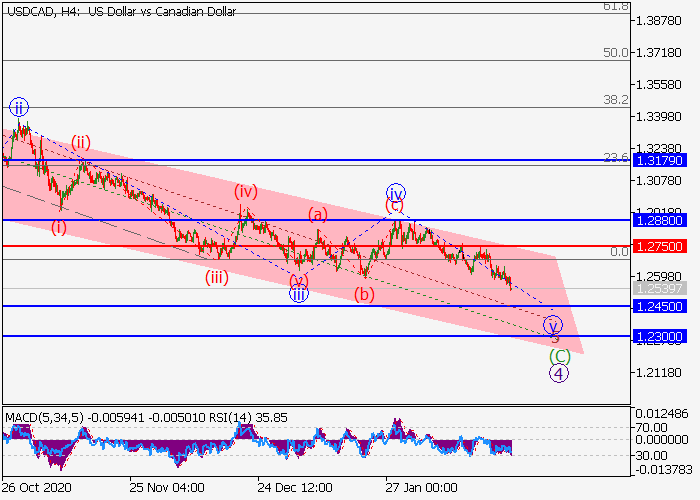
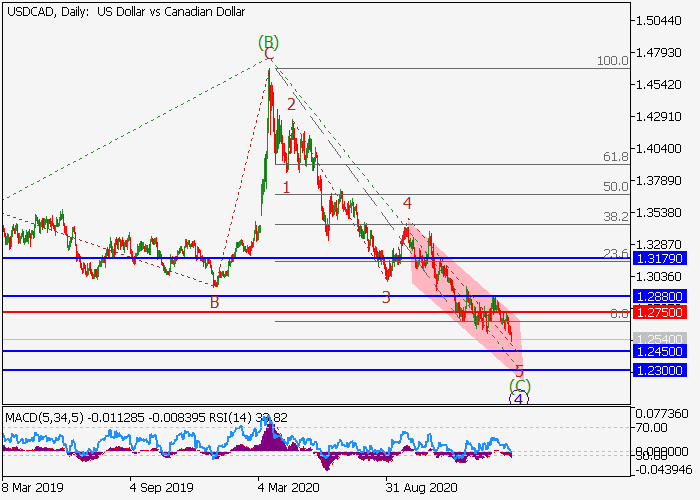
    On the daily chart, the downward wave of the higher level (C) of 4 develops, within which the fifth wave 5 of (C) forms. Now, the third wave of the lower level iii of 5 has formed, a local correction has formed as the wave iv of 5, and the wave v of 5 is developing. If the assumption is correct, the pair will fall to the levels of 1.2450–1.2300. In this scenario, critical stop loss level is 1.2750.


  5. #1215
    Senior Member MikhailLF's Avatar
    Join Date
    Sep 2017
    Posts
    830
    XAU/USD: wave analysis

    The pair is in a correction, a fall is possible.

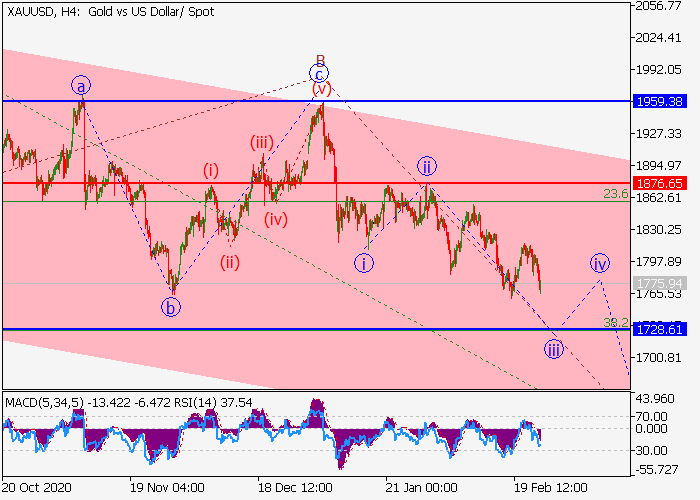
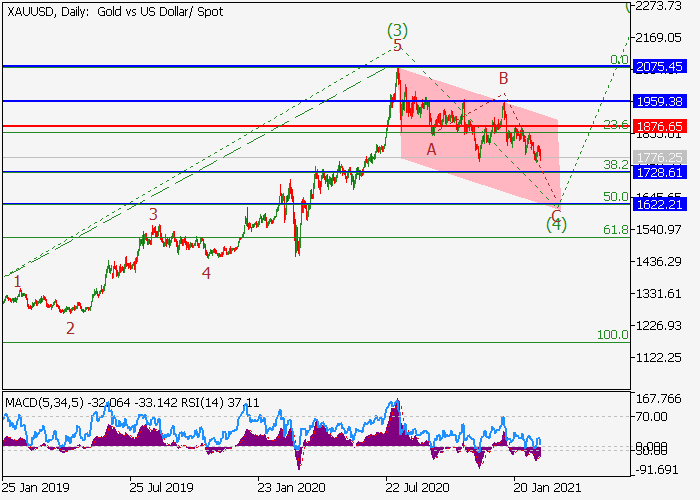
    On the daily chart, the third wave of the higher level (3) formed, and a downward correction develops as the fourth wave (4). Now, the wave C of (4) is forming, within which the wave iii of C is developing. If the assumption is correct, the pair will fall to the levels of 1728.61–1622.21. In this scenario, critical stop loss level is 1876.65.


  6. #1216
    Senior Member MikhailLF's Avatar
    Join Date
    Sep 2017
    Posts
    830
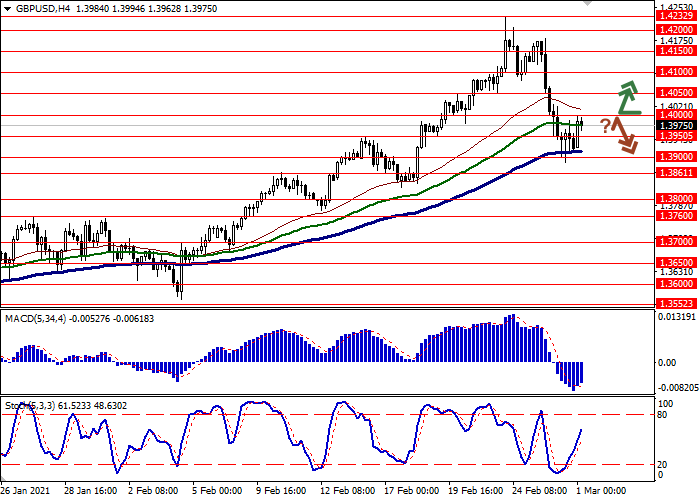
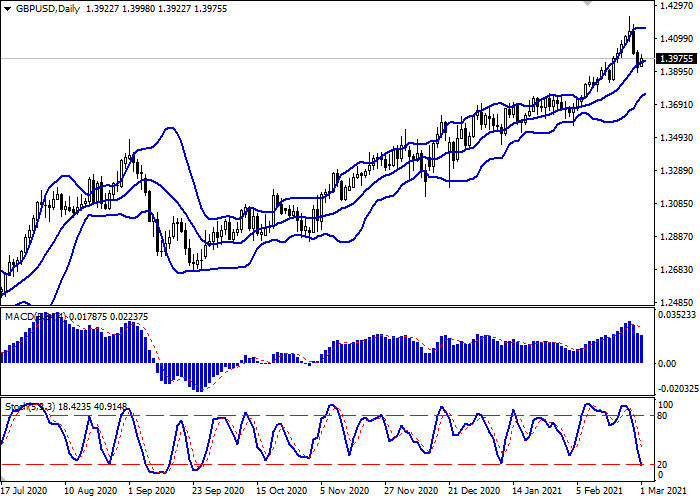
    GBP/USD: recovery after correction

    Current trend

    GBP is correcting against USD in the trading session this morning, recovering from a confident decline at the end of the previous trading week. The weakening of GBP was facilitated by a large-scale correction in the bond market, which provoked a decrease in demand for risky assets. GBP was also under pressure from the comments of the Bank of England officials. Last Friday, the chief economist of the regulator, Andy Haldane, made a speech in which he pointed to the risks of inflation, noting that it will be extremely difficult to contain it as the global economy recovers from the effects of the pandemic.

    Meanwhile, investors continue to praise the effectiveness of the UK coronavirus vaccination campaign, expecting the latest travel restrictions to be fully lifted by summer or fall 2021. Today, traders are awaiting the release of February UK Manufacturing PMI from Markit. Also, data on the dynamics of consumer credit in January will be released.

    Support and resistance

    On the D1 chart, Bollinger Bands demonstrate a tendency to reverse into a horizontal plane. The price range is narrowing, reflecting the emergence of ambiguous dynamics of trading in the short term. MACD is going down preserving a stable sell signal (located below the signal line). Stochastic demonstrates similar dynamics but its line is rapidly approaching its lows, pointing at risks of oversold GBP in the ultra-short term.

    Resistance levels: 1.4000, 1.4050, 1.4100, 1.4150.
    Support levels: 1.3950, 1.3900, 1.3861, 1.3800.


  7. #1217
    Senior Member MikhailLF's Avatar
    Join Date
    Sep 2017
    Posts
    830
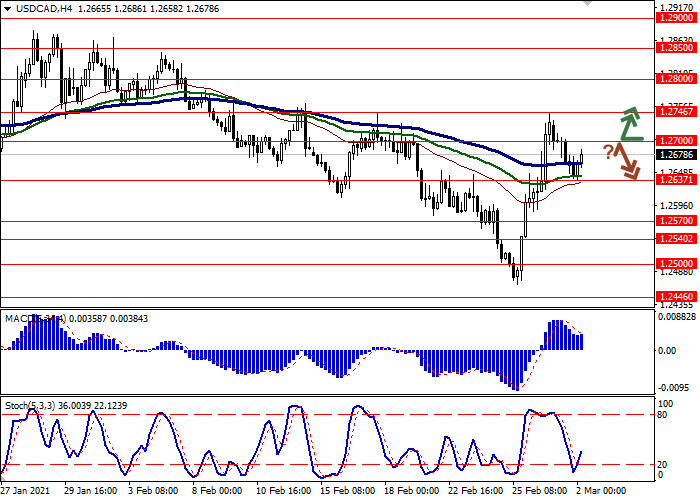
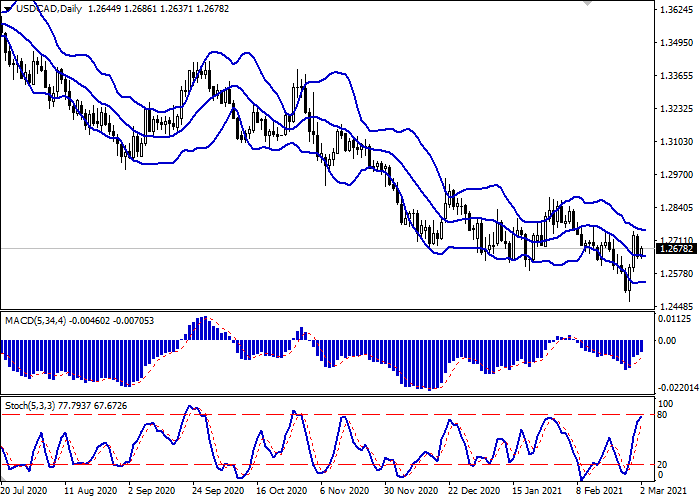
    USD/CAD: recovery after a minor correction

    Current trend

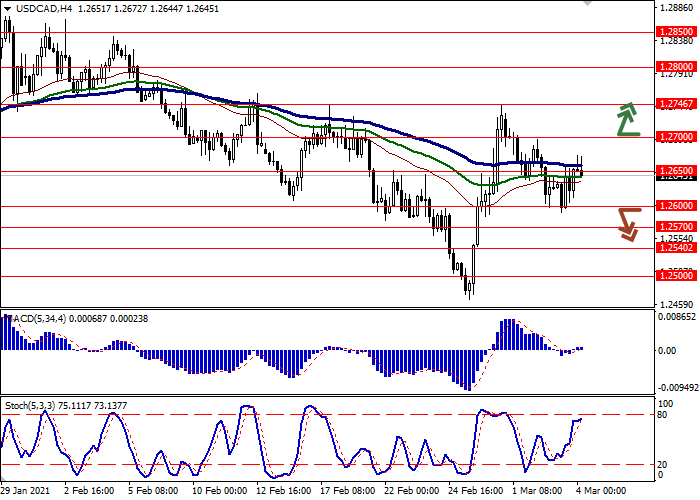
    Today during the Asian session, the USD/CAD pair grows moderately, recovering from Monday's decline, which did not allow it to renew local highs.

    Yesterday’s USD weakening was largely technical since the fundamental picture did not change significantly. Some pressure on the price was exerted by the decline in the yield of American bonds, however, positive US macroeconomic statistics helped to smooth out this negative effect. Thus, ISM Manufacturing PMI for February rose from 58.7 to 60.8 points, while the forecasts assumed growth only to 58.8 points. Markit Manufacturing PMI rose from 58.5 to 58.6 points, in line with market expectations.

    On Tuesday, investors are focused on a block of statistics on the dynamics of Canada's GDP for December and the fourth quarter of 2020. According to preliminary data, the country's economy slowed significantly at the end of last year, which is associated with continuing restrictions due to the coronavirus pandemic.

    Support and resistance

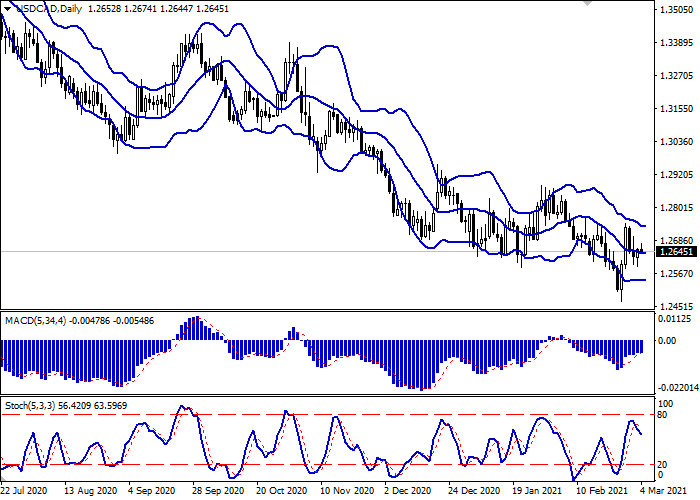
    On the daily chart, Bollinger Bands reverse horizontally. The price range tries to consolidate but remains spacious enough for the current level of activity in the market. MACD grows, maintaining a strong buy signal (the histogram is above the signal line). Stochastic grows but rapidly approaches its highs, signaling that the instrument may become overbought in the ultra-short term.

    It is better to keep the current long positions until the signals from technical indicators are clarified.

    Resistance levels: 1.2700, 1.2746, 1.2800, 1.2850.
    Support levels: 1.2637, 1.2570, 1.2540, 1.2500.


  8. #1218
    Senior Member MikhailLF's Avatar
    Join Date
    Sep 2017
    Posts
    830
    WTI Crude Oil: prices remain under pressure

    Current trend

    Today, during the Asian session, oil prices are slightly increasing, correcting after a three-day decline, which led to the consolidation of the instrument below the psychological level of $60 per barrel.

    Investors expect the emergence of new drivers on the market, which may be the results of tomorrow's OPEC+ meeting. Analysts expect that the cartel may decide to ease restrictions on oil supplies, which could put additional pressure on quotes.

    The American Petroleum Institute's report on energy reserves released yesterday had a negative impact on the instrument. For the week of February 26, the figure rose sharply by 7.356 million barrels after increasing by 1.026 million in the previous period. On Wednesday, traders await the publication of the final report from the US Department of Energy. Forecasts assume a decrease in inventories for the week of February 26 by 1.85 million barrels after rising by 1.285 barrels in the previous period.

    Support and resistance

    On the daily chart, Bollinger Bands reverse into a horizontal plane. The price range is narrowing slightly, reflecting the emergence of multidirectional dynamics in the past few weeks. The MACD indicator is going down, maintaining a strong sell signal (the histogram is below the signal line). Stochastic is also directed downwards but it is near its lows, which indicates that the instrument may become oversold in the ultra-short term.

    Resistance levels: 60.50, 62.18, 63.00, 64.00.
    Support levels: 58.51, 57.25, 55.00, 53.00.


  9. #1219
    Senior Member MikhailLF's Avatar
    Join Date
    Sep 2017
    Posts
    830
    USD/CAD: US macro statistics restrain the “bullish” activity

    Current trend

    Today during the Asian session, the USD/CAD pair trades ambiguously, consolidating near the level of 1.2650.

    The US dollar retains its upward momentum, formed yesterday. However, the American macroeconomic statistics slightly restrain the “bullish” activity on the instrument. In particular, investors reacted negatively to the release of the ADP Nonfarm Payrolls for February and are eagerly awaiting the publication of the final data on the US labor market at the end of the week.

    The data from Canada were slightly better but did not significantly affect the instrument. Building permits for January rose sharply by 8.2% MoM after declining by 4.4% MoM for the previous period.

    Support and resistance

    On the daily chart, Bollinger bands are moving flat. The price range is trying to consolidate but remains wide enough for the current level of market activity. The MACD indicator is growing, maintaining a poor buy signal (the histogram is above the signal line). Stochastic, having not reached the border of the overbought area, reversed into a downward plane, responding to strong "bearish" pressure at the beginning of the week.

    To open new trading positions, it is better to wait for the signals from technical indicators to be clarified.

    Resistance levels: 1.2650, 1.2700, 1.2746, 1.2800.
    Support levels: 1.2600, 1.2570, 1.2540, 1.2500.


  10. #1220
    Senior Member MikhailLF's Avatar
    Join Date
    Sep 2017
    Posts
    830
    EUR/USD: strong USD hinders the growth of the pair

    Current trend

    The day before, the EUR/USD pair fell by 93 points, which was catalyzed by the speech of the US Fed Chair Jerome Powell.

    Investors began to get rid of US stocks and bonds after the head of the regulator disappointed the markets, refraining from decisive action against the growth of Treasury bond yields, considering the fears of the traders far-fetched. He made it clear that at the moment no steps are being prepared to contain the rise in interest rates. The rhetoric of the Fed also contributed to the fall in quotes of the indices: the S&P 500 closed at its lowest level in five weeks, losing 1.3%, while rates on 10-year bonds exceeded 1.5%. Further downtrend in stock indices is likely to lead to the movement of investor capital to more reliable assets such as USD and gold.

    The European Central Bank also does not see the need for decisive action to combat the rise in bond yields, believing that the risk to the economy can be managed through verbal intervention and the flexibility of quantitative easing programs. In turn, high yields on government bonds pose a problem for the eurozone as they are used by banks as a benchmark for lending. According to the ECB representatives, at the moment there is no need to expand the emergency bond purchase program, which is EUR 1.85 trillion. If at the next meeting the regulator voices its concerns about the high rate of EUR, this may negatively affect the quotes in the near future.

    Support and resistance

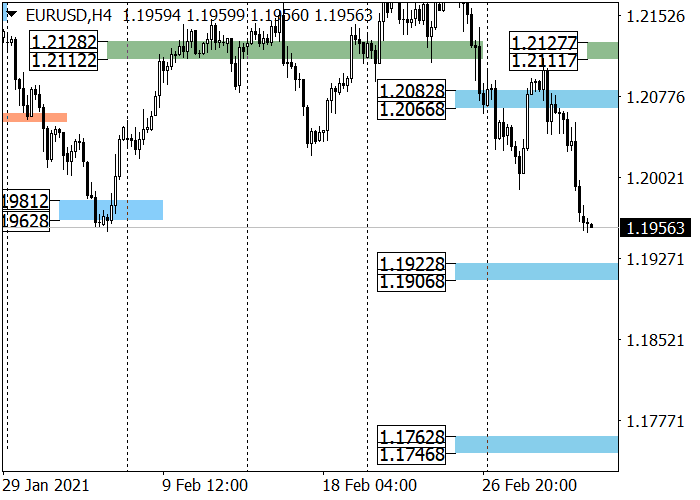
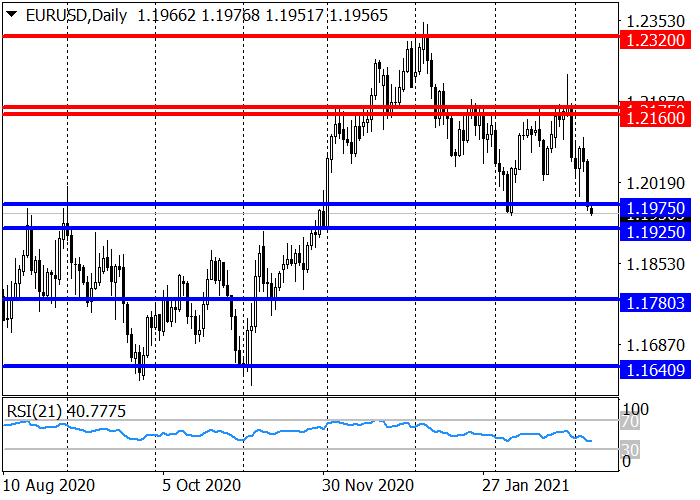
    After holding resistance at 1.2175 last month, EUR rate dropped to the support area of 1.1975–1.1925, in case of a breakdown of which, the instrument will continue to fall with the target at 1.1740.

    This week, the medium-term trend changed to a downtrend (the target zone 1.2082–1.2066 was broken down). The next target is at support at 1.1922–1.1906. The border of the new trend is shifting to the levels of 1.2127–1.2111.

    Resistance levels: 1.2066, 1.2127.
    Support levels: 1.1906, 1.1780.


Page 122 of 128 FirstFirst ... 22 72 112 120 121 122 123 124 ... LastLast

Tags for this Thread

Bookmarks

Posting Permissions

  • You may not post new threads
  • You may not post replies
  • You may not post attachments
  • You may not edit your posts
  •