Page 15 of 22 FirstFirst ... 5 13 14 15 16 17 ... LastLast
Results 141 to 150 of 219
Like Tree1Likes

Stocks, ETFs, Options, Commodities & Currencies

This is a discussion on Stocks, ETFs, Options, Commodities & Currencies within the Analytics and News forums, part of the Trading Forum category; Our articles, Technical Trading Mastery book , and 3 Hour Trading Video Course are designed for both traders and investors ...


  1. #141
    Senior Member Technician's Avatar
    Join Date
    Feb 2013
    Posts
    220

    “Average Joe ” Panic Selling on New York Exchange


    Our articles, Technical Trading Mastery book, and 3 Hour Trading Video Course are designed for both traders and investors to explore the tools and techniques that discretionary and algorithmic traders need to profit in today’s competitive markets. Created with the serious trader and investor in mind – whether beginner or professional – our approach will put you on the path to win. Understanding market structure, trend identification, cycle analysis, volatility, volume, when and when to trade, position management, and how to put it all together so that you have a winning edge.

    more...

  2. #142
    Senior Member Technician's Avatar
    Join Date
    Feb 2013
    Posts
    220

    Economic Pressures To Driving Metals Higher Long-Term

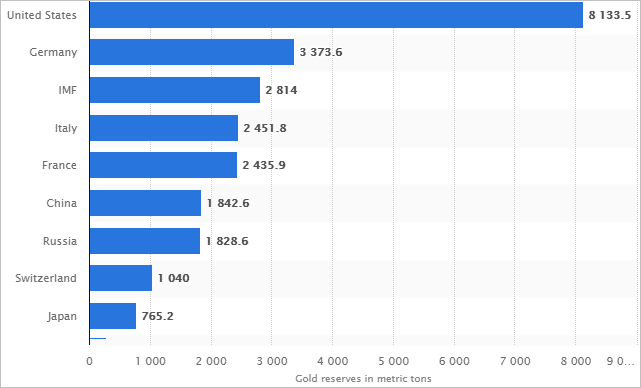
    The below chart showing top gold reserves being accumulated by countries.


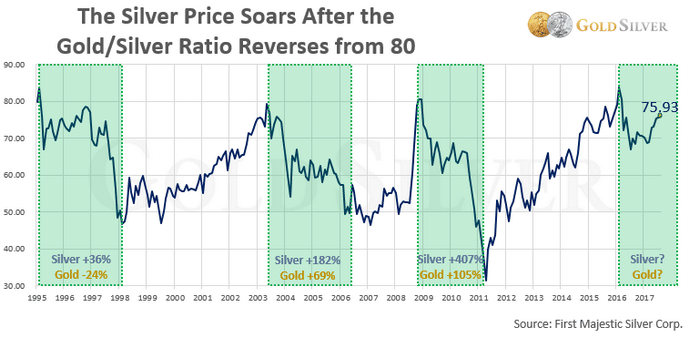
    Comparatively, the Gold to Silver ratio is indicating that it would take nearly 79.66 ounces of Silver to equal 1 ounce of Gold (in terms of price comparison). This level typically indicates that Silver is dramatically undervalued compared to Gold. Yet, as we believe the price of Gold is about to launch to new highs and potentially push much higher into the future, this would indicate that opportunities for investment in either Gold or Silver could be substantial.


    Our predictive modeling system is showing a very strong likelihood that Gold will rally to near $1380 within just a few weeks and continue to rotate near this level for a period of many weeks. This move, establishing a new recent high price level as well as potentially prompting a rising fear level in global investors may prompt a disparity in the Gold to Silver price ration resulting in a much more dramatic price advance in Silver.

    Investors should prepare for a moderately strong price advance in the precious metals that may be associated with a US Dollar price decline as well as a moderate price advance in certain commodities. Now is the time to think about how you can profit from these moves and the potential disparity in the Gold/Silver price ratio.

    more...

  3. #143
    Senior Member Technician's Avatar
    Join Date
    Feb 2013
    Posts
    220

    Weekly Predictions for Gold, Oil, and SPX – VIDEO

    March 12, 2018


    more...

  4. #144
    Senior Member Technician's Avatar
    Join Date
    Feb 2013
    Posts
    220

    A Technical Traders Outlook on Oil, Gold, and Stocks Indexes


    April 4, 2018


    TO PREDICT THE UPCOMING MOVES IN PMS AND OIL LOOK TO THE USD AND US MARKETS

    Chris Vermeulen, from The Technical Traders, shares his outlook for the precious metals and oil by relating how he thinks the USD and US markets will move in the next couple weeks. With the USD rebounding slightly we can expect some more upside. As for the US markets, a bounce is also expected as we continue the choppy sideways movement.

  5. #145
    Junior Member
    Join Date
    Apr 2018
    Posts
    1
    Follow rajveervyas On Twitter Add rajveervyas on Facebook
    Add rajveervyas on Linkedin
    Zoid Research Excellent Stock tips give an awesome chance to financial specialists to gain more profit definitely in India. Zoid research use to give exact and gainful stock tips to financial specialists with the goal that they could acquire a flawless income for their capital. Therecght be some shares, which have performed verifiable, well over an explicit time frame or a drawn out stretch of time. Zoid research complaints are false they give the best platform, which give you lots of opportunities in the share market with the profitable return back of the investment. We are the best stock market tips in Indore .

  6. #146
    Senior Member Technician's Avatar
    Join Date
    Feb 2013
    Posts
    220

    How to Trade Indexes with Fibonacci

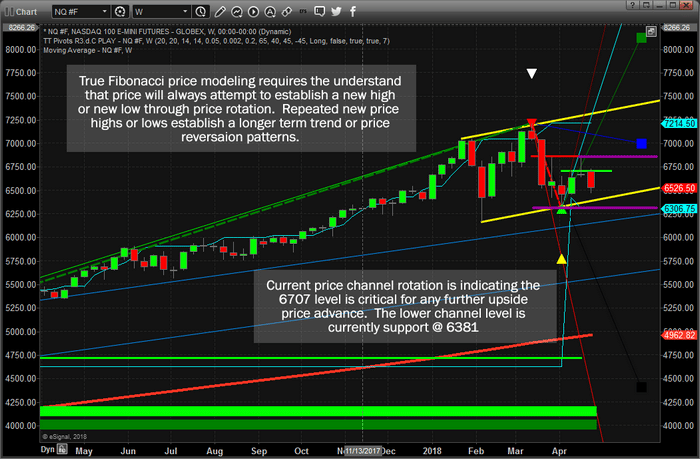
    Today, we are going to illustrate how this modeling system assists us and how we attempt to use it to identify trading opportunities and longer term potentials for success. As of April 24, the markets closed dramatically lower – by almost -2% on average. This move lower pushed many of the current prices into a unique price pattern that may be very temporary. We will start by attempting to illustrate the NQ chart with our Fibonacci price modeling system and we want to make one thing very clear….

    Today’s downside price rotation, excluding the ES chart, setup a new potential for future bearish trending if the current price is unable to recovery back above the key Fibonacci Bullish Price Level.

    Let’s get started with the NQ chart. The first things we want you to concentrate onto are the YELLOW price channel and the PURPLE price high/low ranges established by price rotation. It is critical that you understand how price rotation, pure price, sets up all of the analysis that this modeling system completes. Nothing else is used other than price and time. The most recent price high and low levels (in most cases) establish the Fibonacci price range. This is what we use to make trending decisions.

    This current NQ chart has rotated lower and is currently telling us that we should expect further downside price activity as long as price stays below the Fibonacci Bullish Price Level. Although, our ADL price modeling system is warning that the markets will enter a strong upside rally within days. Thus, it is our opinion that this recent move is a “wash-out” low price rotation that is attempting to fade the longs. The NQ Fibonacci price high is at 6867 and the Fibonacci price low is at 6307 – watch for these levels to be breached before trend accelerates.


    The ES chart is set in a similar price formation to the NQ chart. Highlighted on this chart are three primary components of our Fibonacci price modeling system; the projected price levels, the Bullish & Bearish Fibonacci key price levels and the key market price rotation markers (tops and bottoms/price rotation points). Understanding our modeling system is key to your better understanding the research that we provide to you. On the right side of this chart, we’ve highlighted two key projected price levels with lines drawn in CYAN (light blue). We want you to pay special attention to those projected price levels because they became key support and resistance just a few weeks ago. If you understand the significance of this example, you’ll begin to see how past price rotations attempt to predict future price turning points using advanced Fibonacci concepts and theory.
    IMPORTANT NOTE: If all of this is a little to advanced to understand, that’s ok too. Maybe you don’t want to understand or learn, and just want nothing but our best trade setups and alerts? Well, members can have our SMS trade alerts so they get only our Buy, Stop, and Profit Taking alerts. Meaning you have trade like a pro and only spend 10-30 minutes a weak to adjust a position or enter a new one as you receive an alert!
    This ES chart is showing a similar analysis to that of the NQ – expect continued bearish price action unless the current Bullish Fibonacci price level is breached @ 2718.50. Again, we believe this current downside price move is a “wash-out” low price rotation within a bullish trend. One of the reasons we believe this to be the case is clear if you understand price rotation. Look at the entirety of the move recent price rotation. After establishing the key low price bottom, price has failed to attempt to take out that low.
    Remember, price must always attempt to establish new highs or new lows through price rotation within Fibonacci theory. Therefore, until that low is breached, and as long as new higher low has been created, price is failing to commit to new lower lows. Thus, it must be attempting to commit to higher highs. The ES Fibonacci price high is at 2718.50 and the Fibonacci price low is at 2552.00.


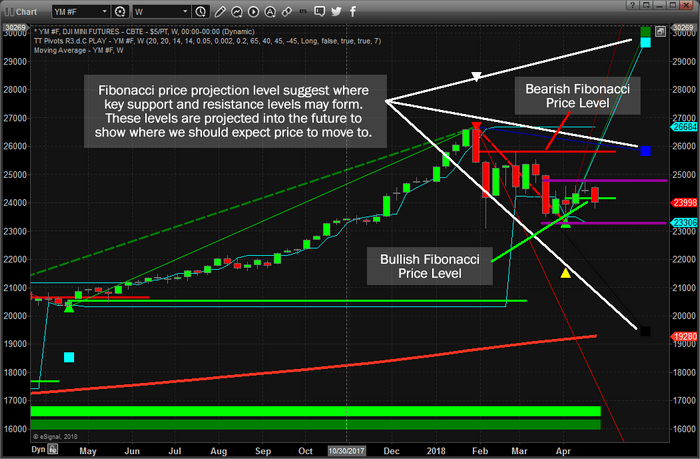
    The YM chart below provides the clearest picture, in our opinion, of the detailed Fibonacci price rotation process. Very similar setups in price are still in place between all three charts. Yet, the price rotation on the YM chart provided clear confirmation that price was attempting to advance rather than collapse recently. The Bullish Fibonacci Price Level on the right side of the chart was breached and confirmed three weeks ago with a close above 24135. The NQ and ES did not achieve this key price element in Fibonacci theory.
    Additionally, the BLUE downside price projection point was very shallow compared to the recent peak high. This is typically a sign that any price rotation may be shallow as well and short lived. As of the recent closing, the current close is below the Bullish Fibonacci Price Level, thus we are expecting some potential weakness in price until it advanced back above this level. Yet, our believe that this “wash-out low” is a process of targeting near priced longs is still valid. If, at the end of this week, price is back above the Bullish Fibonacci Price Level, we will have further confirmation that this downside move was just a “wash-out low”. The YM Fibonacci price high is at 24827 and the Fibonacci price low is at 23306.


    more...

  7. #147
    Senior Member Technician's Avatar
    Join Date
    Feb 2013
    Posts
    220

    Crude Oil Possibility For A Big Downside Move

    Demand for Oil is tied to the economic activities throughout much of the globe. When demand for Oil is high, one can perceive the global economy to be performing well and consumer demand for oil-based products rather high. When demand for oil subsidies, it is usually due to economic constraints as a result of slower consumer and industrial demand. The only time demand for oil typically skyrockets are when massive supply disruption takes place or war breaks out.

    Stocks, ETFs, Options, Commodities & Currencies-brentcrud-d1-fx-choice-limited-2.png


    Current price rotation to the upside has reached and stalled near an upper price channel and coincides with our Tesla Vibrational Theory price arcs. We believe this could be setting up for a big downside price move in the near future. Our interpretation of this setup is that Oil will quickly find pricing pressures near the $74-$75 level and begin to move lower.
    Before we continue much further, let's take a look at some statistical data for the Month of July with Crude Oil.

    more...

  8. #148
    Senior Member Technician's Avatar
    Join Date
    Feb 2013
    Posts
    220

    US Elections May Trigger Major Market Bottom

    In this second part of our US election research post, we are going to continue to review topics that were previously discussed as well as highlight how certain market segments appear to be setting up for a massive price reversal. So, let’s get started.

    Stocks, ETFs, Options, Commodities & Currencies-1-4.png


    Keeping in mind the information we presented in Part 1 of this research, our hypothesis is that US elections cycles present a huge opportunity for skilled traders by creating volatility and rotation in price and many segments of the global markets. Over the past 3+ years, we have been writing about what we call a “capital shift” that has been taking place. Near the end of the Obama presidency (2015 & 2016), a number of factors were taking place in the US and global economy. First, the start of the new Presidential Election cycle events was already working through the news cycles – the selection of the candidates. Second, China had recently instilled capital controls to prevent a capital outflow issue and to support their bulging economy locally. Lastly, emerging markets and oil had collapsed, putting incredible pressures on certain foreign markets to support their local economies and find suitable sources for their investments as currencies started to collapse as well.

    This event, that actually started in 2014 or so, initiated what we call the “capital shift” where cash quickly moved out of risky investments and hunted for and deployed within safer investment structures – the US and major global equity markets. In particular, we believe the US Technology, healthcare and biotech sectors were huge beneficiaries of these new capital investments and we believe as these share prices started increasing, more and more capital kept flowing into these sectors – like a dog chasing his tail. The price advances seem to never end… until the 2016 election cycle event. This caused the entire global equities markets to pause for a few months as Hillary Clinton and Donald Trump battled it out.

    Within this Weekly XLF chart, you can see how quickly after the US presidential election the Financial Sector sprung back to life – rallying nearly 20% within the 6 weeks following the Trump victory. This is a massive move for investors and traders. Skilled traders know to watch for these setups within election cycle events and this is the one reason we are writing this article for you today – to keep you informed that massive trading opportunities exist over the next 3~6+ weeks.

    You can also see from this chart that by the time President Trump was sworn into office, the XLF price rotated within a 12~15% range before the new Trump policies and objectives began to be announced (near October 2017). At that time, the Financial sector skyrocketed again by another 35~40% – reaching a peak near $30.60 in January 2018. Pay attention to what we are trying to suggest to you as skilled traders, we are about 7~10 days away from a US mid-term election that will likely present opportunities like this again and we want all of you to understand the huge potential for very big price swings that are setting up right now. The XLF is trading near $25.25 and any upside potential to near recent highs would reflect a 12~15% price increase (or more). Should this mid-term election result in increased fear in the markets and a related price downturn, the nearest support highlighted by the WHITE line on this chart would reflect a -9% price decrease. Either way, up or down, the potential for the Financial sector to generate big gain is already there – waiting for us to execute.

    more...

  9. #149
    Senior Member Technician's Avatar
    Join Date
    Feb 2013
    Posts
    220

    Gold (XAU/USD) - Weely Bear Market Rally

    Today’s upside price move in gold, already up over $18 (+1.5%), sets up a real potential for a move to near $1300 before the end of November. We have been advising our followers that a strong potential for an upside move in the precious metals markets was likely and that a potential move to above $1300 was in the works prior to the end of 2018.

    Stocks, ETFs, Options, Commodities & Currencies-xauusd-d1-fx-choice-limited.png


    Global economic concerns and the fact that global central banks are accumulating physical gold are putting pricing pressures on Gold and many of the other precious metals. This is a sleeper trade in many ways, the US equity markets and the US Dollar are much stronger than many expected. A true capital shift is taking place throughout the globe at the moment and many foreign nations and central banks are hedging risk by accumulating physical gold. When the price of Gold does really start to move higher, it could be an explosive move to the upside – just like what happened back in 2005~2008 and 2009~2012.

    Our predictive modeling systems are suggesting Gold could rally to above $1500 /oz in 2019 and we believe the current price levels are a gift for traders. Sub $1300 price levels may be the lowest prices we see for quite a while – don’t miss this opportunity to position your portfolio for this next move.

    more...

  10. #150
    Senior Member Technician's Avatar
    Join Date
    Feb 2013
    Posts
    220

    Will Oil Find Support Near $60?

    We believe the support near $65, although clearly broken, may eventually become resistance for a future upside price move. Our proprietary Fibonacci price modeling system is suggesting a new target near $52~53 and we believe this downside move in Oil is far from over at this point.

    Stocks, ETFs, Options, Commodities & Currencies-brentcrud-w1-fx-choice-limited.png


    The current global climate for Oil is that suppliers are pumping more and more oil into the market at a time when, historically, prices should continue to decline. One of our research tools includes the ability to identify overall bias models for each week, month or quarter. Historically, Oil is dramatically weaker in the month of November and relatively flat for the month of December.

    more...

Page 15 of 22 FirstFirst ... 5 13 14 15 16 17 ... LastLast

LinkBacks (?)


Tags for this Thread

Bookmarks

Posting Permissions

  • You may not post new threads
  • You may not post replies
  • You may not post attachments
  • You may not edit your posts
  •